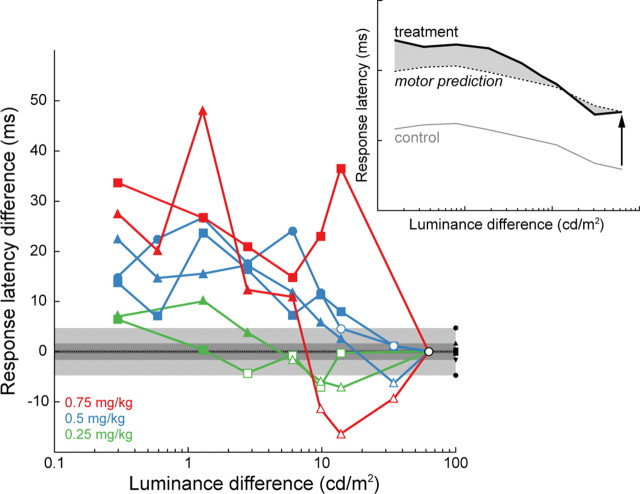
Figure 4.
Difference between the response latency in treatment trials and that predicted by the sum of the mean response latency in the corresponding control session and at the highest contrast difference (86.1%). Data from each animal is indicated by a different symbol (triangle, monkey G; square, monkey F; circle, monkey H). Response latency differences were determined to be statistically significant (solid symbols) if they exceeded by 2 SD the mean latency difference calculated in the saline sessions (black symbols and gray areas). Inset, Schematic of the calculation of response latency difference (shaded area): RLDx = TLx − [CLx + (TL86.1% − CL86.1%)], where RLDx is the response latency difference at X luminance difference; TLx and CLx are the mean response latencies at X luminance difference in the treatment and control blocks, respectively; and TL86.1% and CL86.1% are the mean treatment and control block latencies at the highest luminance difference. Inset example is from Figure 2C.

