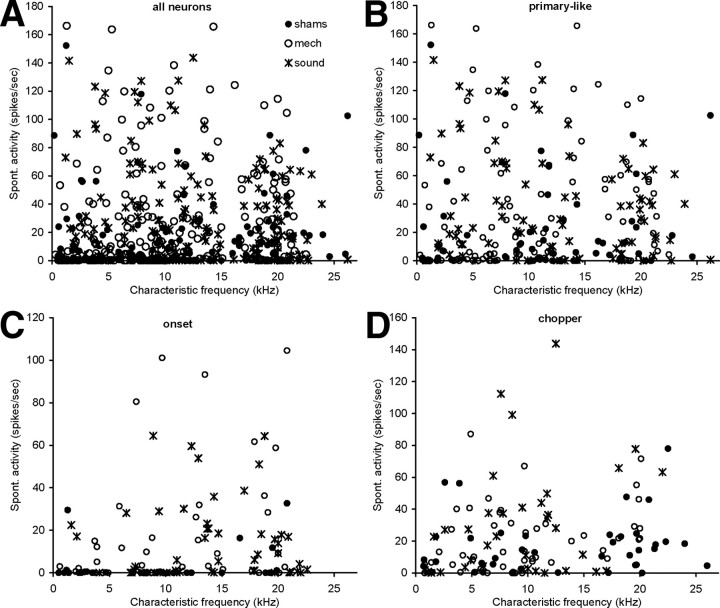
Figure 7.
Scatter plots showing characteristic frequency against spontaneous activity of all neurons (shams, sham group; mech, mechanical lesion group; sound, acoustic trauma group) (A), primary-like neurons (B), onset neurons (C) and chopper neurons (D). Neurons recorded from the different experimental groups are indicated with different symbols.

