
Figure 3.
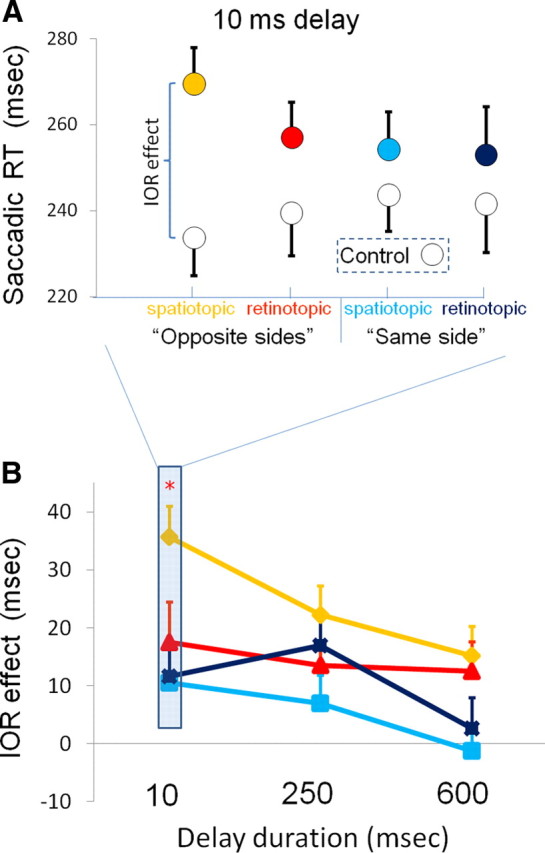
Saccadic response time results; spatiotopic IOR effects are maximal at the shortest delay and decrease with longer delays. A, Average SRTs for the same-side trials (red; orange) and opposite-sides (blue; light blue) trials, when the postsaccadic delay was 10 ms. The colored circles are the ones in which the cue and target had the same retinotopic position (darker colors: dark blue, red) or the same spatiotopic position (brighter colors: light blue, orange). Note that, when the target and distractor shared the same coordinates, in either frame of reference, the SRTs were longer than to targets at matched control locations (white circles). B, The dependence of the IOR effect on the delay between the end of the intervening saccade and target presentation. Spatiotopic effects are most prominent as early as 10 ms after completion of the intervening saccade, on opposite-sides trials. The red asterisk denotes significance level of p < 0.05 for comparisons between spatiotopic and retinotopic effects in opposite-sides trials. Error bars denote SEM across subjects (N = 25).