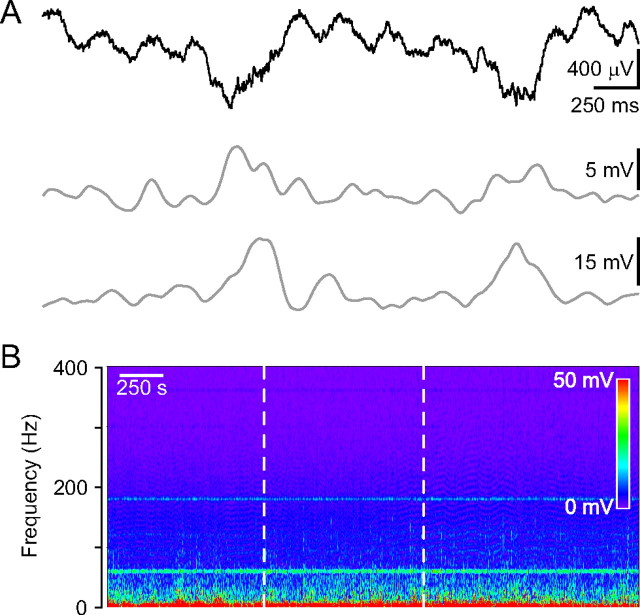
Figure 3.
In vivo field potential recording from the dorsal hippocampal CA1 region in urethane anesthetized mice. A, Field potential recording showing two large negative deflections emerging from the normal theta rhythm (top). High (63–119 Hz range; middle)- and low-gamma (30–57 Hz range; bottom) components riding on the large negative deflection. B, Frequency spectrogram of the hippocampal field potential recording. The laser illumination (20 mW) by itself did not induce changes in the spectrogram (dotted white lines mark the duration of the laser illumination). Six minutes before the laser illumination physiological saline injection was injected instead of rose bengal.

