
Figure 7.
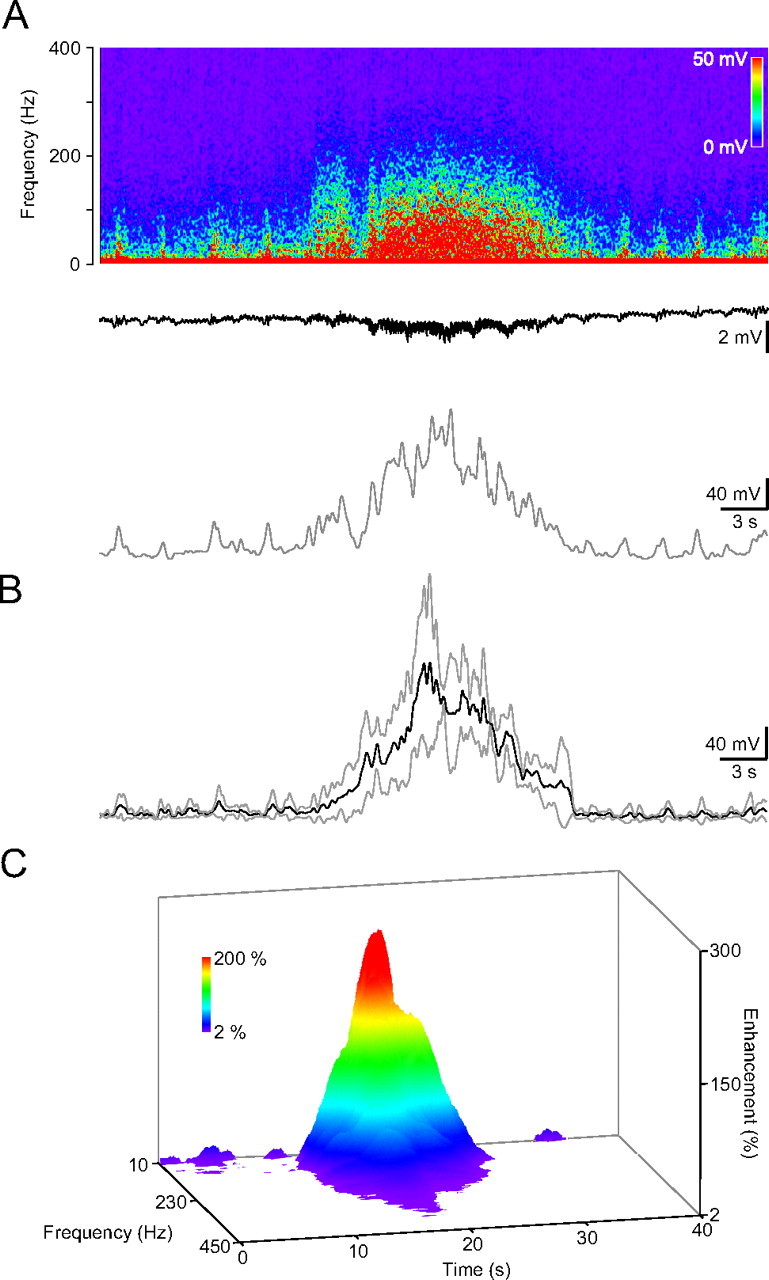
HFD appears in the contralateral hippocampus. A, Frequency spectrogram of the in vivo recording from the dorsal hippocampal CA1 region (top), the recorded DC activity (middle trace) and the average amplitude in the low gamma, 30–57 Hz range. Note the missing DC voltage shift after the HFD. B, Averaged HFD in the low-gamma range (dark trace, gray traces, ±SD; n = 4). C, Color-coded 3-D surface spectrogram of the averaged contralateral HFD.