
Figure 2.
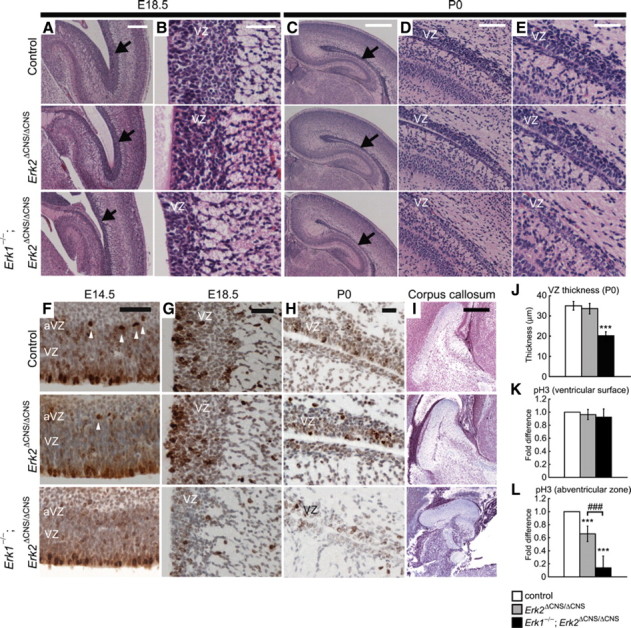
The VZ is thinner in Erk1/2 DKO mice. A, Comparison of sagittal sections at E18.5 shows that the VZ is markedly thinner in Erk1/2 DKO mice than in Erk2 CKO or control mice. Arrows indicate the VZs. B, Higher-power views of the VZs. C, Similar to at E18.5, comparison of coronal sections at P0 shows that the VZ is markedly thinner in Erk1/2 DKO than in Erk2 CKO or control mice. Arrows indicate the VZs. D, E, Higher-power views of the VZs. These sections show that the VZ was markedly thinner in Erk1/2 DKO mice. F, The majority of pH3+ cells were found on the ventricular surface in all genotypes at E14.5. In Erk2 CKO mice, the number of pH3+ cells in the abventricular zone (arrowheads) was reduced compared with controls. In Erk1/2 DKO mice, a more dramatic decrease was observed compared with controls or Erk2 CKO mice. G, At E18.5, pH3 staining was decreased in Erk1/2 DKO mice, but not in Erk2 CKO mice, compared with controls. H, At P0, staining for pH3 shows decreased proliferation in the VZ of Erk1/2 DKO mice, but not in Erk2 CKO mice, compared with controls. I, The size of the corpus callosum is reduced in Erk1/2 DKO mice compared with Erk2 CKO or control mice. J, The thickness of the VZ is reduced in Erk1/2 DKO mice compared with controls. K, L, The fold differences in the numbers of pH3+ cells in the ventricular surface and in the abventricular zone are calculated (n = 5 mice for each). J, The numbers of pH3+ cells in the ventricular surface are not different between genotypes. L, On the other hand, the numbers of pH3+ cells in the abventricular zone are significantly reduced in Erk2 CKO and Erk1/2 DKO mice compared with controls. Scale bars: C, I, 500 μm; A, 250 μm; D, 100 μm; B, E–H, 50 μm. ***p < 0.001 compared with control; ###p < 0.001.