
Figure 5.
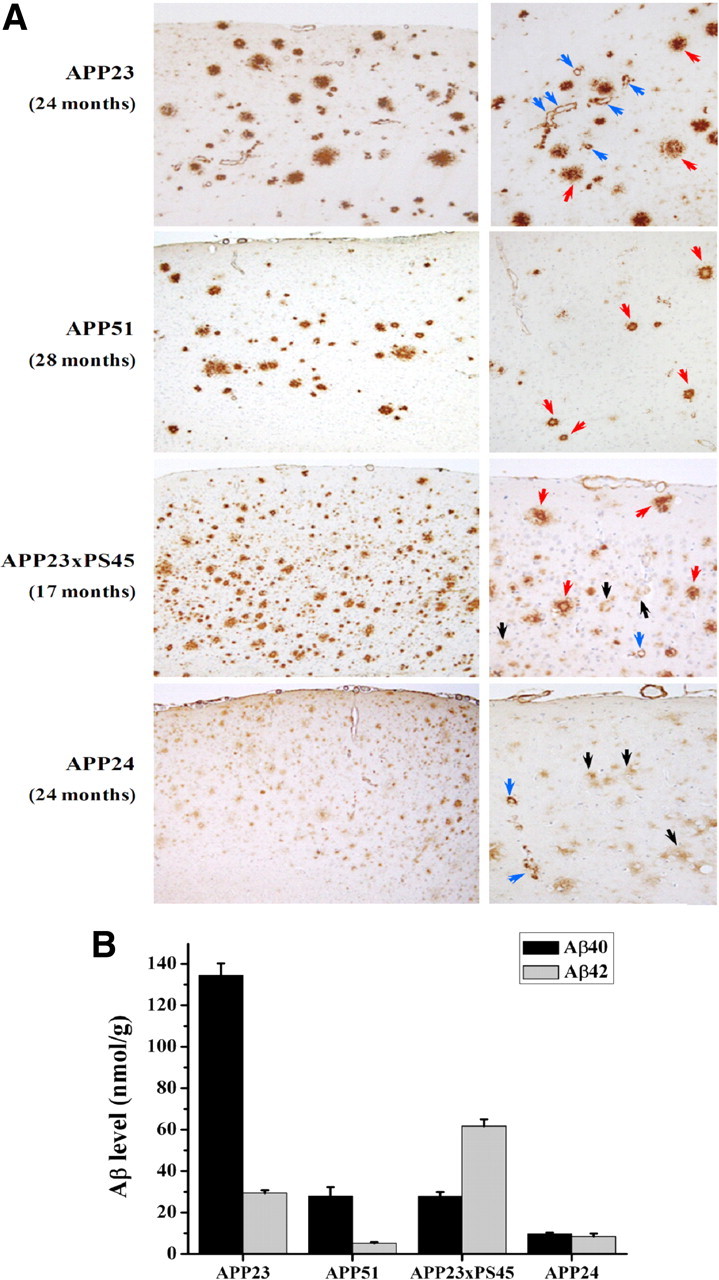
Characterization of various transgenic mouse lines differing by the relative amount of CAA and parenchymal amyloid plaques. A, Histological sections were stained with a rabbit polyclonal antibody to Aβ (NT12) indicating the presence of amyloid plaques (red arrows), diffuse plaques (black arrows), and vascular amyloid (blue arrows). Note the difference in CAA frequency as well as severity between the lines. B, Forebrain concentrations (means ± SEM) of Aβ40 and Aβ42 for the different APP transgenic mouse lines at the ages used: APP23 (24- to 28-month-old male mice, n = 20), APP51 (28-month-old female mice, n = 7), APP23xPS45 (13- to 17-month-old male mice, n = 6), and APP24 (26-month-old male mice, n = 18) animals.