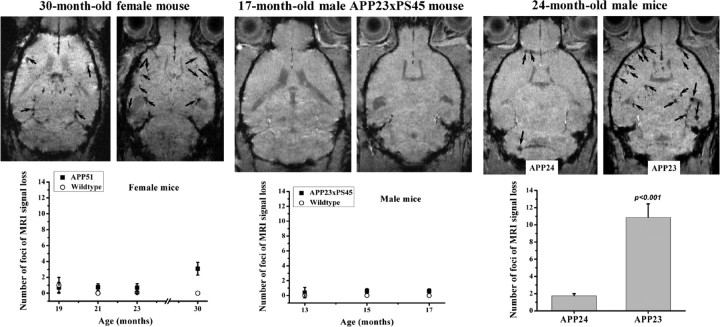
Figure 6.
Comparison of the different APP transgenic mouse lines for foci of MRI signal attenuation in the cerebral cortex. Representative images from each line are presented with corresponding signal attenuation foci indicated by arrows. The number of sites is given as means ± SEM. Five to twelve animals were analyzed per group and time point. The level of significance p refers to Mann–Whitney statistical comparisons. Images were acquired 24 h after SPIO injection.

