Figure 2.
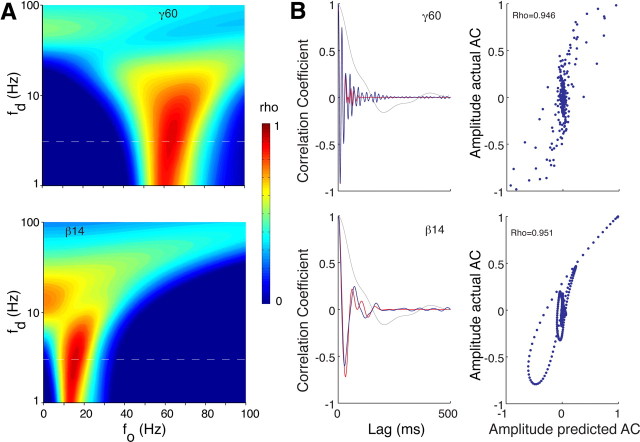
Slow LFP oscillations predict amplitude fluctuations in higher-frequency bands. A, Matrices show mean (n = 9 animals) Spearman's ρ values (color scale) for the correlations between the actual AC for γ60 (top) and β14 (bottom) and predicted AC generated by Gabor functions from different combinations of fo (pure sine wave, x-axis linear scale) and fd (damping frequency, y-axis log scale) terms. White dashed line indicates fd = 3 Hz. B, Left show predicted AC (red lines) with fd = 3 Hz for fo = 60 Hz (top) and 14 Hz (bottom), overlaid on the actual AC (blue lines) for γ60 and β14 LFP recorded from one rat. Gray line shows the autocorrelation for the delta (0.1–3 Hz) band. Right scatter plots show the actual and predicted AC amplitudes, at all lags, for the data in the left, and the respective correlation coefficient (Spearman's ρ).

