Figure 3.
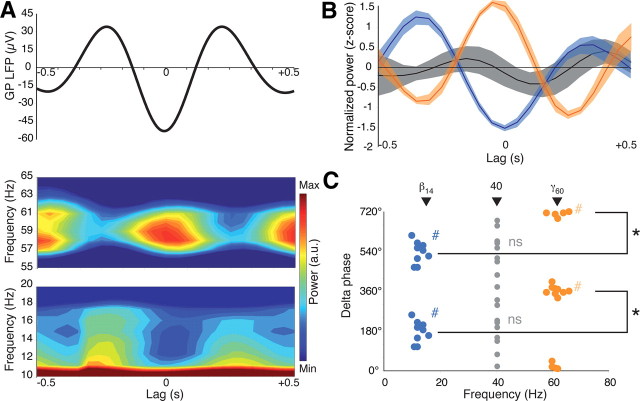
Fluctuations in power of specific frequencies nest within slow oscillations. A, Waveform shows average delta (0.1–3 Hz) bandwidth filtered LFP, triggered on trough, for one rat. Color PETPS plots show examples of fluctuations in power in higher-frequency bands (top, 55–65 Hz; bottom, 10–20 Hz), around the delta trough. Power shown by color scale in arbitrary units (a.u.). B, Group data. Color bands show the average ± SEM normalized (z-score, n = 9 rats) trough-triggered perievent-time power at β14 (blue), γ60 (orange), and 40 Hz (gray). C, Points show the delta phase (0 = trough) at which maximum power occurs for β14, γ60, and 40 Hz, for each animal. #p < 0.05 compared with random distribution (Rayleigh's test); *p < 0.05 comparing delta phase distributions of different frequencies (Watson's U2 test).

