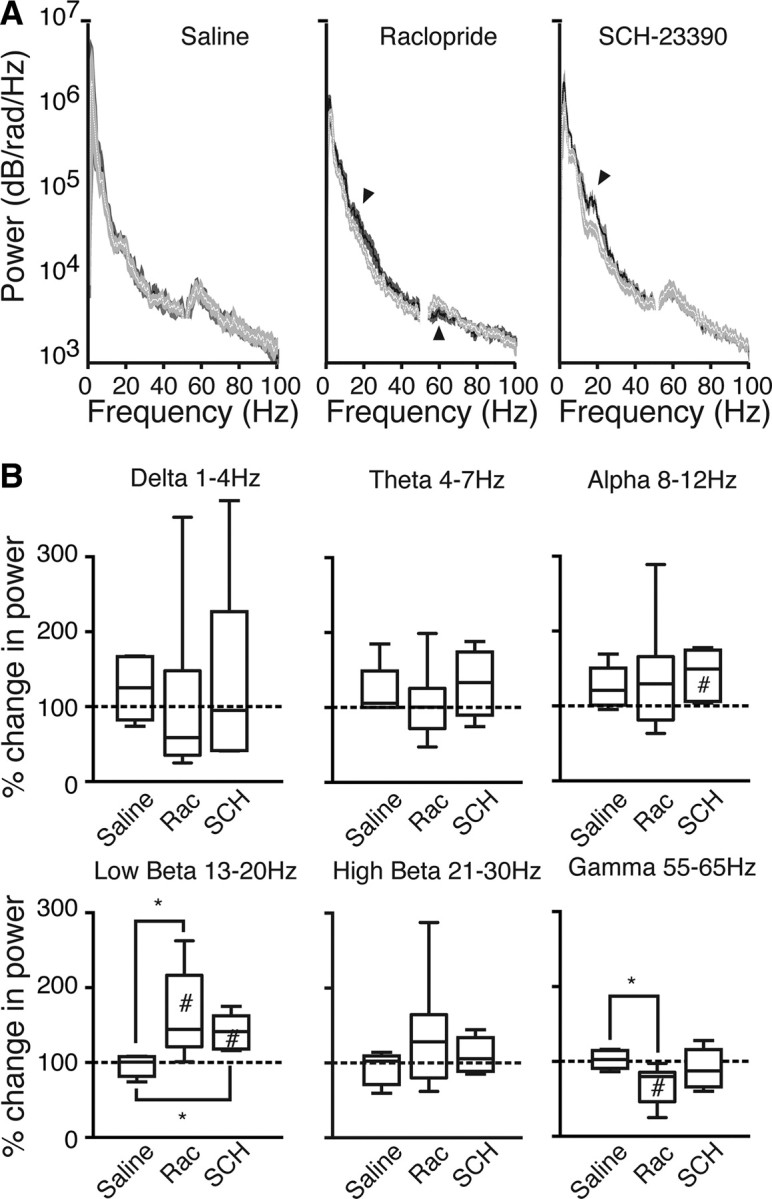
Figure 4.

D1 and D2 receptor antagonists differentially modulate oscillations in beta and gamma bands. A, Mean ± SEM power spectral density, from before injection (white line and light gray shading) and after injection (black line, dark gray shading) of saline, raclopride, or SCH23390. Arrowheads indicate significant deviations of post-injection from pre-injection data, quantified in B. B, Box plots show predrug–postdrug power ratios in different frequency bands for saline (n = 6), raclopride (Rac; n = 9), and SCH23390 (SCH; n = 6) treatments. #p < 0.05 compared with 1:1; *p < 0.05 compared with saline treatment.
