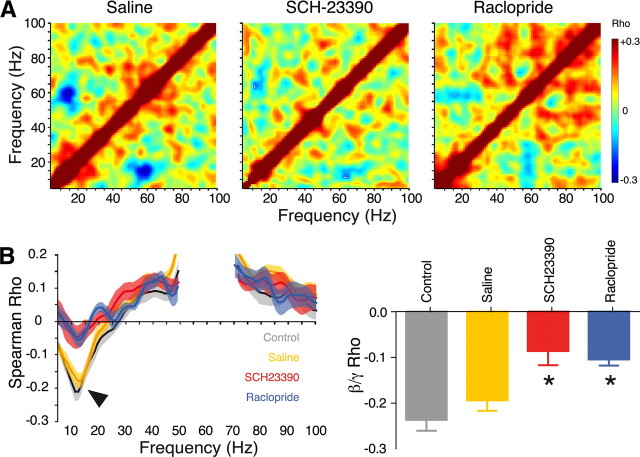
Figure 5.
Dopamine antagonists downregulate the negative correlation between beta and gamma power. A, Example data. Matrices show Spearman's ρ correlation coefficient (color scale) for all frequency pairs, for one rat, after saline, SCH23390, or raclopride injection. B, Group data. Color bands show the average ± SEM Spearman's ρ correlation between γ60 and other frequencies (5–100 Hz), before injection of saline (control, gray) and after injection of saline (yellow), SCH23390 (red), or raclopride (blue). Arrowhead indicates negative correlation with the beta band before and after saline injection. Histogram shows mean ± SEM Spearman's ρ for the maximum negative correlation between γ60 and frequencies in the 10–30 Hz band, in each condition. *p < 0.001 compared with saline.

