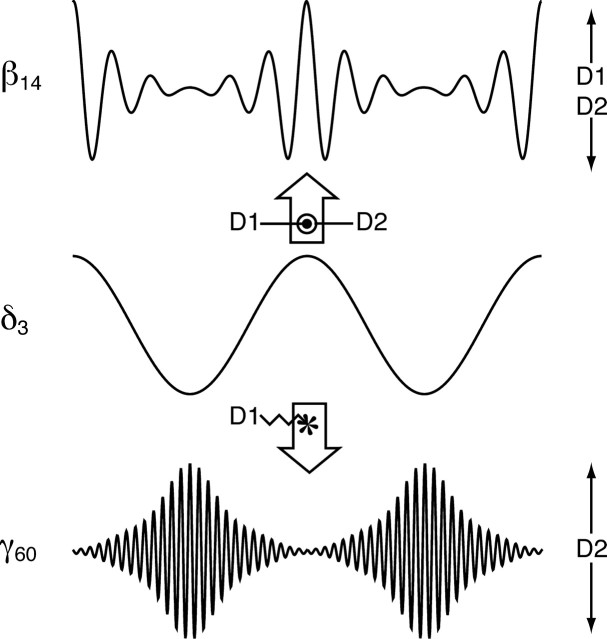
Figure 7.
Diagram summarizing hierarchical organization of dopamine-dependent frequency interplay within rat GP. Line arrows (right side) indicate dependence of β14 mean power on both D1 and D2 dopamine receptors and of γ60 mean power on D2 receptors alone. Block arrows highlight the temporal relationship between δ3 phase and fluctuations of power in γ60 and β14, which are in anti-phase relative to each other. The differential modulation of the temporal relationships with δ3 by dopamine receptor subtypes is also indicated; lines terminating in circles indicate effect on strength, whereas zigzag line terminating in asterisk indicates an effect on phase of the relationship.

