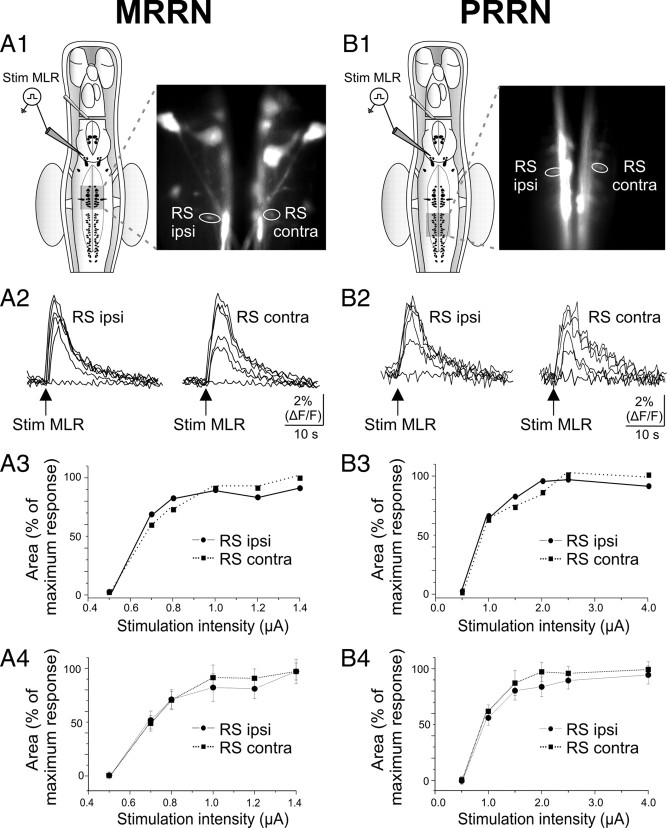
Figure 3.
Symmetrical bilateral Ca2+ responses in smaller-sized RS cells after electrical stimulation of the MLR. A, MRRN data. B, PRRN data. A1, B1, Schematic representations of the dorsal view of the brainstem of a larval lamprey with photomicrographs illustrating calcium green dextran-labeled RS cells in the MRRN (A1) and in the PRRN (B1) from the same preparation. Pairs of homologous RS cells were delineated and labeled as ipsilateral (RS ipsi) and contralateral (RS contra) to the MLR stimulation, as indicated for one example on the photomicrographs. A2, B2, Ca2+ responses in both the ipsilateral and contralateral RS cells to MLR stimulation of different intensities. Each trace was obtained at the following single-shock intensities: 0.5, 0.7, 0.8, 1.0, 1.2, 1.4 μA for the MRRN (A2) and 0.5, 1.0, 1.5, 2.0, 2.5, 4.0 μA for the PRRN (B2). A3, B3, Graph illustrating the relationship between the intensity of MLR stimulation and the area of the Ca2+ responses for the pairs of RS cells illustrated in A2 and B2. A4, B4, Graph illustrating the relationship between the intensity of MLR stimulation and the mean ± SEM area of the Ca2+ responses for eight pairs of RS cells in the MRRN and six pairs in the PRRN.

