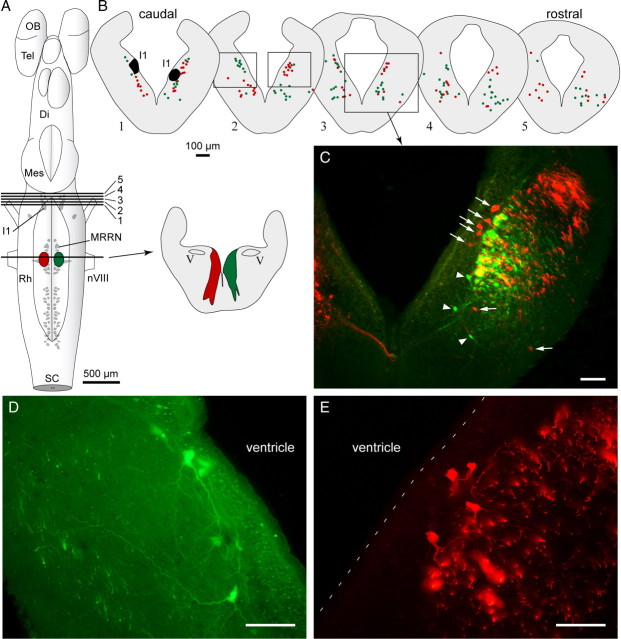
Figure 6.
Distribution of retrogradely labeled cell bodies in the isthmic region after injection of two fluorescent dextran amine tracers in the MRRN, one on each side. A, Schematized dorsal view of the brain of a larval stage lamprey showing approximate location of injection sites into the MRRN and the level of the cross sections 1–5 represented in B. The lesioned area from each injection is indicated on the cross section to the right. B, Schematized cross sections of the brain at the isthmic levels indicated in A with colored dots, each representing one neuron labeled with its respective tracer. Double-labeled neurons were rarely found, and none were found in this particular animal. C, Photomicrograph illustrating an example of the distribution of labeled neurons in the isthmic region as seen in epifluorescence microscopy. The green neurons (arrowheads) are ipsilateral and the red neurons (arrows) are contralateral to their respective injection sites. All the other labeled structures are axons, some being larger than neurons, which is common in lampreys. The yellow color results from the superimposition of distinct green and red axons from different focal planes in the 25-μm-thick section. D, E, Higher-power photomicrographs illustrating examples of neurons labeled with one of the two tracers. The approximate location of the picture frames is indicated on cross section 2 in B. Di, Diencephalon; I1, Müller isthmic cell I1; Mes, mesencephalon; nVIII, vestibular nerve; OB, olfactory bulb; Rh, rhombencephalon; SC, spinal cord; Tel, telencephalon; V, trigeminal motor nucleus. The 100 μm scale bar applies to all cross sections. Scale bars in photomicrographs 50 μm.

