Figure 5.
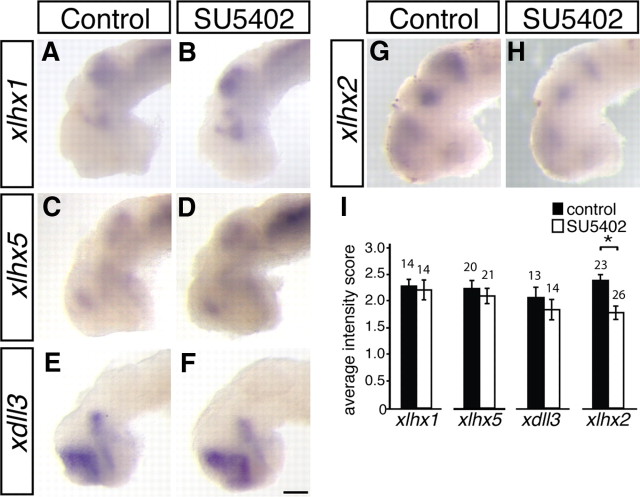
Forebrain map generally maintained after late-stage FGFR inhibition. A–H, Stage 33/34 embryos were exposed to a control DMSO (A, C, E, G) or 100 μm SU5402 (B, D, F, H) solution for 10 h and then processed for xlhx1 (A, B), xlhx5 (C, D), xdll3 (E, F), and xlhx2 (G, H) expression by in situ hybridization. I, Each embryo was photographed and scored in a blinded manner: a score of 1 indicates light staining, and a score of 3 indicates dark staining. The average score for control- and SU5402-treated groups is summarized in the bar graph. No change in xlhx1, xlhx5, or xdll3 expression was observed after exposure to SU5402, but xlhx2 expression was diminished. Scale bar, 100 μm. Graphs show mean ± SEM. *p < 0.01, Mann–Whitney rank sum test.

