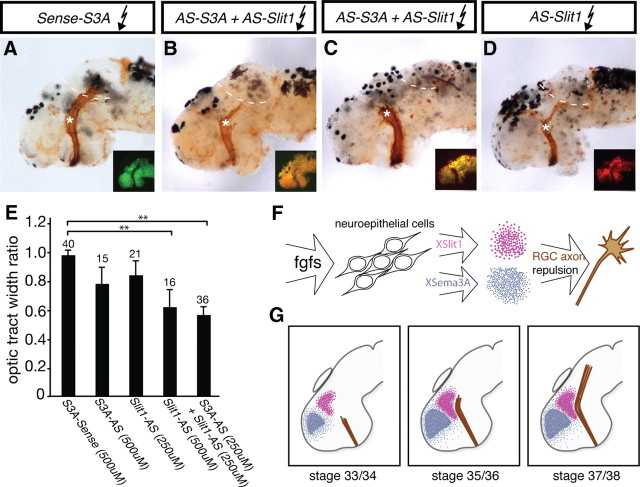
Figure 6.
RGC axons fail to navigate beyond the mid-diencephalon when XSema3A and XSlit1 levels are diminished. Fluorescently tagged antisense oligonucleotides targeted to xsema3A and xslit1 mRNA were introduced into stage 28 embryos via electroporation, and, at stage 39, optic tracts were anterogradely labeled with HRP. To maintain fluorescence, brains were not dehydrated and cleared as they were in Figure 2, so tracts appear less distinct. Differences in the thickness of the optic projections is at least in part accounted for by small variations in effectiveness of the HRP-labeling method. A–D, Shown here are embryos electroporated with 500 μm xsema3A-S control (A), 250 μm xslit1-AS plus 250 μm xsema3A-AS (B, C), or 500 μm xslit1-AS (D) oligonucleotides. Insets show distribution of oligonucleotides. A severe arrested-at-turn phenotype is obvious in C, whereas milder arrested-at-turn phenotypes are shown in B and D: at least half of the RGC axons stop at the mid-diencephalic with the remaining axons extending on toward the optic tectum. E, Optic tract widths were measured for pre-turn and post-turn sections of the optic tracts, as described in Figure 2E. A significant decrease in the optic tract width ratio was observed after electroporation with 500 μm xslit1-AS or 250 μm xslit1-AS plus 250 μm xsema3A-AS (S3A-AS) when compared with xsema3A-S (S3A-Sense) electroporated control embryos. F, G, Schematic illustrating model: F depicts FGFs signaling to neuroepithelial cells and promoting expression of xsema3A and xslit1, which go on to guide RGC axons. G, At stage 33/34, XSema3A and XSlit1 are present in advance of incoming RGC axons, and, by stage 35/36, RGC axons can sense these two guidance cues. The repulsive gradient generated by XSema3A and XSlit1 drives RGC axons caudally toward the optic tectum (stage 37/38). Asterisks indicate site of mid-diencephalic turn, and dotted lines indicate approximate rostral boundary of optic tectum. Graph indicates mean ± SEM. **p < 0.01, Newman–Keuls post hoc test.

