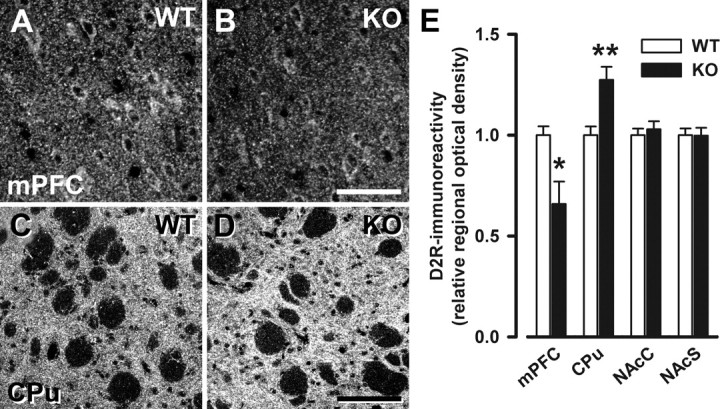
Figure 6.

Selective changes in D2R immunoreactivity in Nogo-A−/− mice. A–D, Representative images of immunostaining with D2R in the medial prefrontal cortex (A, B) and the dorsal striatum (C, D) of Nogo-A+/+ and Nogo-A−/− mice. E, Quantitative analysis of the D2R staining. The relative optical density of D2R was reduced in the medial prefrontal cortex (mPFC; *p < 0.05) of Nogo-A−/− mice, whereas it was elevated in the dorsal striatum (CPu; **p < 0.01). No changes were observed in the nucleus accumbens core (NAcC) and shell (NAcS) regions. Note the differences in staining intensity between the striatum and the medial prefrontal cortex with the typically high levels in the striatum. All values are mean ± SEM. Scale bars: A, B, 50 μm; C, D, 100 μm. KO, Nogo-A−/− (n = 6–7); WT, Nogo-A+/+ (n = 6–7).
