
Figure 2.
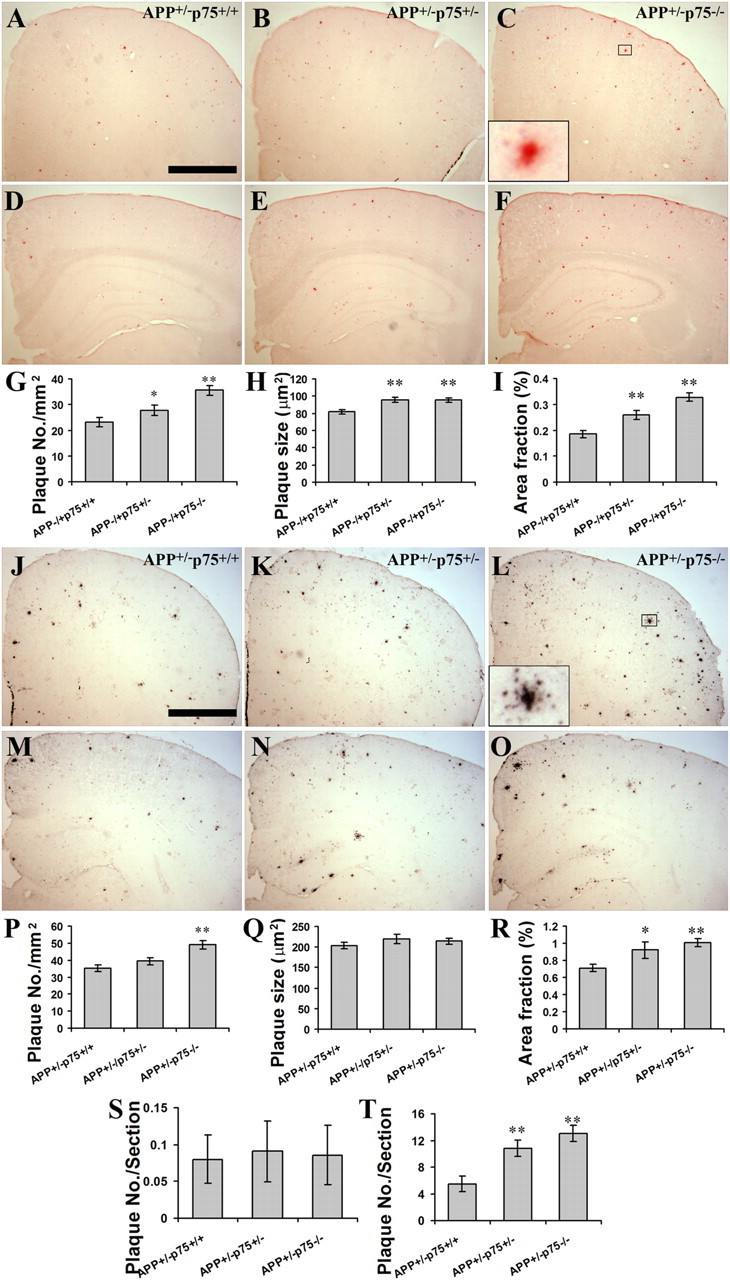
Aβ plaque burden in the brain of mice with different genotypes. A series of five equally spaced tissue sections (∼1.3 mm apart) spanning the whole brain were stained using free-floating immunohistochemistry for total Aβ plaque, or using Congo red staining for compact Aβ plaque (n = 10 in each group). A–C, Congo red-positive Aβ plaques in frontal lobe of 9-month-old APP+/−p75+/+, APP+/−p75+/−, and APP+/−p75−/− mice. D–F, Congo red-positive Aβ plaques in hippocampus of 9-month-old APP+/− p75+/+, APP+/−p75+/−, and APP+/−p75−/− mice. G–H, Comparison of Congo red-positive Aβ plaque density (G), average size (H), and area fraction (I) in neocortex and hippocampus of 9-month-old animals. J–L, IHC-positive Aβ plaques in frontal lobe of 9-month-old APP+/−p75+/+, APP+/−p75+/−, and APP+/−p75−/− mice. M–Q, IHC-positive Aβ plaques in hippocampus of 9-month-old APP+/−p75+/+, APP+/−p75+/−, and APP+/−p75−/− mice. P–R, Comparison of IHC-positive Aβ plaque density (P), average size (Q), and area fraction (R) in neocortex and hippocampus of 9-month-old animals. S, T, Comparison of Congo red-positive Aβ plaque density in the brains of 3- (S) and 6- (T) month-old animals. * and ** denote p < 0.05 or p < 0.01 versus APP+/−p75+/+. Scale bar, 1 mm.