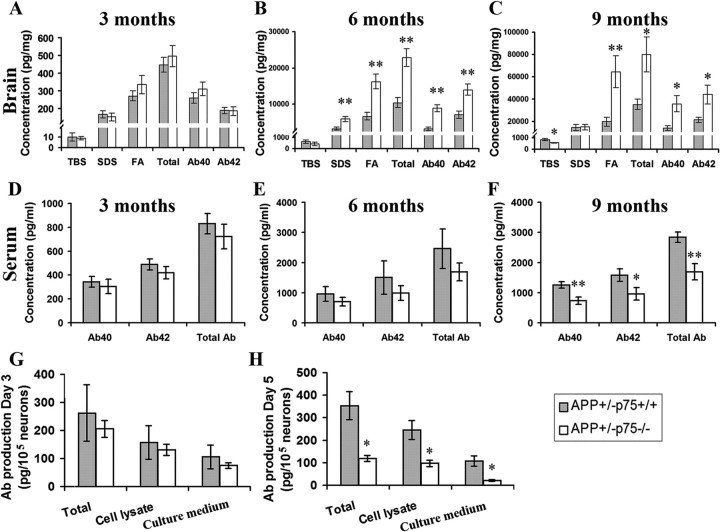
Figure 3.
Aβ levels in the brain and Aβ productions in vitro. A–C, Comparison of Aβ in TBS, SDS, and FA and total Aβ, Αβ40, and Αβ42 among groups at 3, 6, and 9 months of age (n = 10 in each group). Aβ in the brain was extracted sequentially in TBS, 2% SDS, and 70% FA water solution. Aβ peptide concentrations in the brain of animals were measured by ELISA. D–F, Comparison of total Aβ, Aβ40, and Aβ42 in serum at 3, 6, and 9 months of age. Aβ peptide concentrations in the serum of animals were measured by ELISA. G–H, Aβ production of cortical neurons in vitro. The cortex of 1-month-old female APP+/−p75+/+ and APP+/−p75−/− mice was isolated and cultured at 2.5 × 10⁵/ml in Neurobasal A/B27 with 0.5 mm glutamine, 5 ng/ml bFGF, 10,000 U/ml penicillin, and 1 mg/ml streptomycin in triplicate. Both culture medium and cell lysate prepared in RIPA buffer were collected after culture for 3 (G) and 5 (H) days and measured for Aβ by ELISA. * and ** denote p < 0.05 or p < 0.01 versus APP+/−p75+/+ mice.

