
Figure 1.
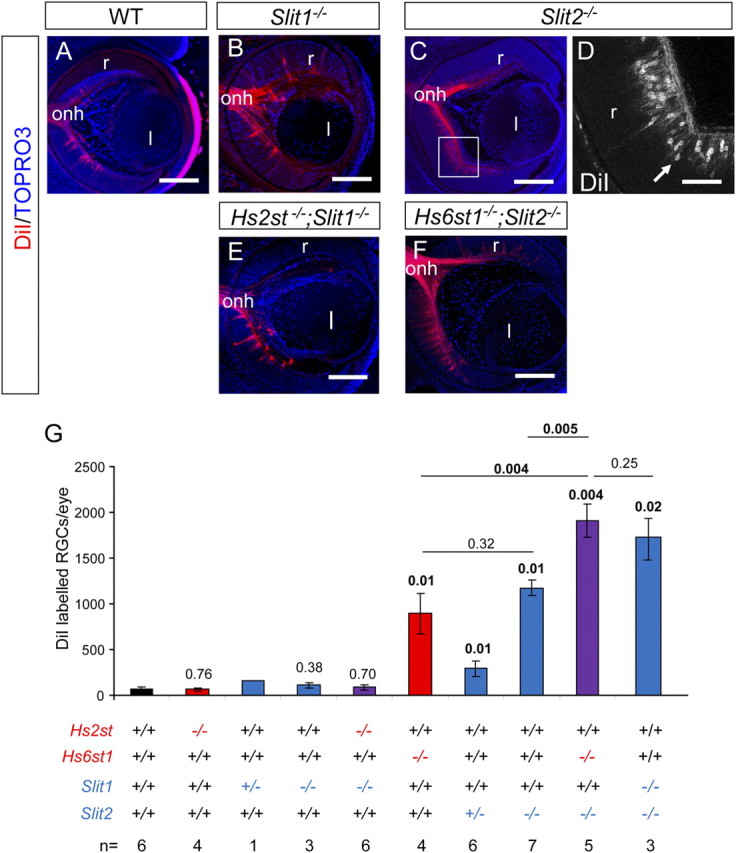
Slit and Hst;Slit double mutant inter-retinal innervation phenotypes at E15.5. A–F, DiI labeling of RGCs projecting to the contralateral retina in wild-type (A), Slit1−/− (B), Slit2−/− (C, D), Hs2st−/−;Slit1−/− (E), and Hs6st1−/−;Slit2−/− (F) embryos. Although RGCs project to the contralateral retina in all genotypes, more are retrogradely labeled in Slit2−/− (C) (D is a magnification of box in C showing retrogradely labeled RGC bodies) and Hs6st1−/−;Slit2−/− embryos (F). G, Quantification of numbers of RGCs retrogradely labeled by DiI injection into the contralateral retina in wild-type, Hs2st−/−, Slit1+/−, Slit1−/−, Hs2st−/−;Slit1−/−, Hs6st1−/−, Slit2+/−, Slit2−/−, and Hs6st1−/−;Slit2−/− embryos. Hs6st1−/− (sixth bar), Slit2+/− (seventh bar), Slit2−/− (eighth bar), Hs6st1−/−;Slit2−/− (ninth bar), and Slit1−/−;Slit2−/− (10th bar) values are significantly greater than wild-type. Slit2−/− and Hs6st1−/− values are not significantly different from each other, both are significantly different from the Hs6st1−/−;Slit2−/− genotype, and there is no significant difference between Hs6st1−/−;Slit2−/− and Slit1−/−;Slit2−/− genotype. Kruskal–Wallis one-way ANOVA on ranks between all groups p < 0.001. p Values for statistically significant differences (p < 0.05) are in bold. Numbers above bars indicate p values for pairwise comparison of ranks for each genotype to wild-type using Dunn's method. p Values for pairwise comparisons between other genotypes are shown above horizontal lines bracketing the genotypes. Error bars are ±SEM. Numbers of embryos of each genotype analyzed are indicated at the very bottom. l, Lens; r, retina; onh, optic nerve head. All sections horizontal with caudal at top. Scale bars: A–C, E–F, 200 μm; D, 100 μm.