Figure 2.
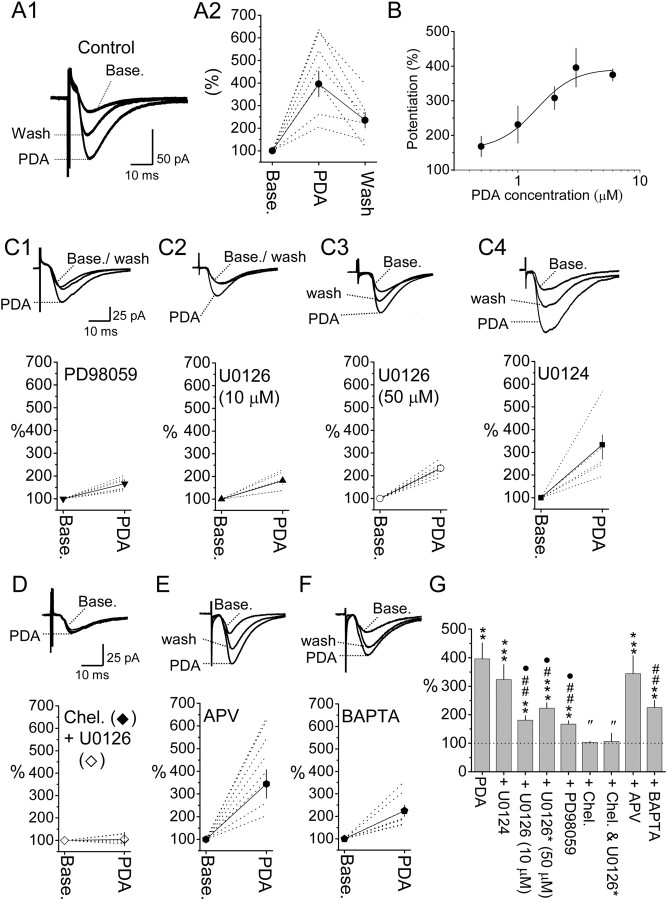
PDA application potentiates PBA–CeAC EPSCs. A, B, Effect of bath application of 3 μm PDA (A) and the dose-dependent effect of PDA (B) on PBA–CeAC EPSCs. In A1, traces shown are an overlay of representative raw data recorded at baseline, during 3 μm PDA application, and during washout. In A2, the dotted lines and symbols plus solid lines in the plot are individual and summarized results, respectively. C–F, The upper traces are an overlay of representative raw data recorded at the baseline, during PDA application, and after washout; the trace in D is for pretreatment with U0126 and chelerythrine. The time and amplitude scales shown in C1 also apply to C2–C4, and those shown in D also apply to E and F. The dotted lines and the symbols plus solid lines in the lower plot are individual and summarized results, respectively. C, Effect of addition of PD98059 (C1) or pretreatment of slices with 10 μm (C2) or 50 μm (C3) U0126 or 10 μm U0124 (C4) on potentiation by PDA. D–F, Potentiation by PDA in chelerythrine-bathed slices (black diamonds) or chelerythrine-bathed plus U0126-pretreated slices (white diamonds) (D), APV-bathed slices (E), or neurons intracellularly perfused with BAPTA (F). G, Summarized result and statistical comparisons. The asterisks indicate a statistical comparison of the test result and baseline results using the paired t test, while # indicates statistical comparison with the result for PDA under control conditions, • comparison with U0124 treatment, and ″ comparison with U0126 (10 or 50 μm) or PD98059 by one-way ANOVA. A single symbol indicates p < 0.05, two symbols p < 0.01, and three symbols p < 0.001.

