Figure 3.
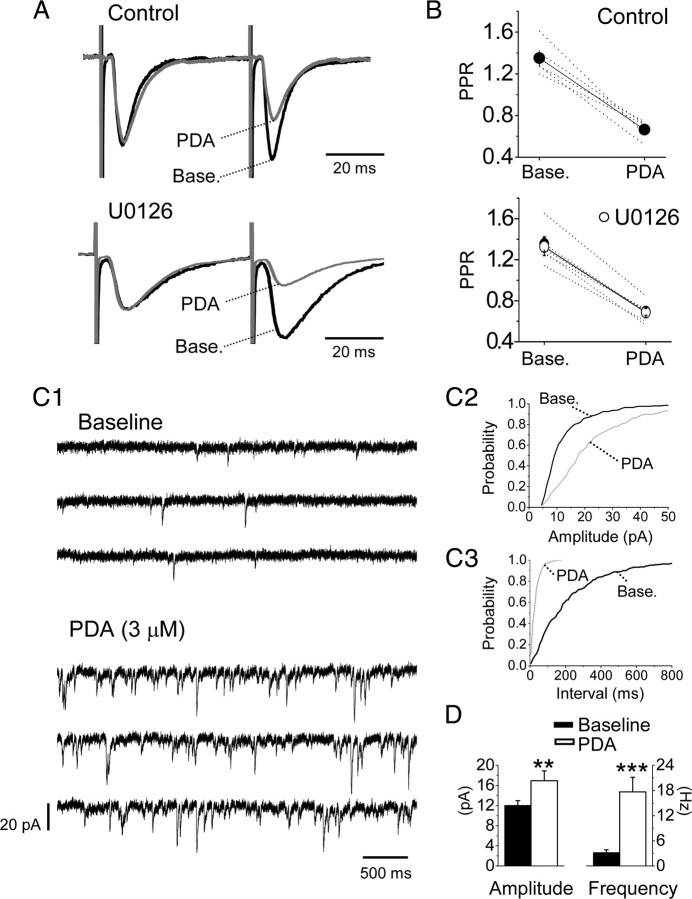
The potentiation effect of PDA application on PBA–CeAC EPSCs involves both presynaptic and postsynaptic modulation. A, Representative raw data recorded from CeAC neurons showing responses to paired-pulse stimulation at baseline and during PDA application in control (upper traces) and U0126-pretreated (lower traces) slices. Normalizing the response to that for the first pulse revealed a decrease in the PPR caused by PDA application. B, Summarized results (symbol plus solid line) showing that PDA application significantly decreased the PPR in control (top) and U0126-pretreated (bottom) slices. The dotted lines show results of individual experiments. For comparison, summarized results for control slices (filled circles) are superimposed on the results for the U0126-pretreated slices (white circles). C, Effects of PDA application on mEPSCs. C1, Representative raw data recorded from a CeAC neuron showing recording of mEPSCs at baseline (top three traces) and during PDA application (bottom three traces). C2, C3, Cumulative distribution of analyzed amplitudes (C2) and interevent intervals (C3) of mEPSCs showing a significant decrease in the interevent interval and an increase in the amplitude on PDA application (K–S test). All the data shown in C are from the same neuron. D, Summarized results from five cells showing a significant increase in the mean amplitude (left plot) and mean frequency (reciprocal of the interevent interval) (right plot). The asterisks indicate a statistical comparison with the baseline result using the paired t test (*p < 0.05, **p < 0.01, and ***p < 0.001).

