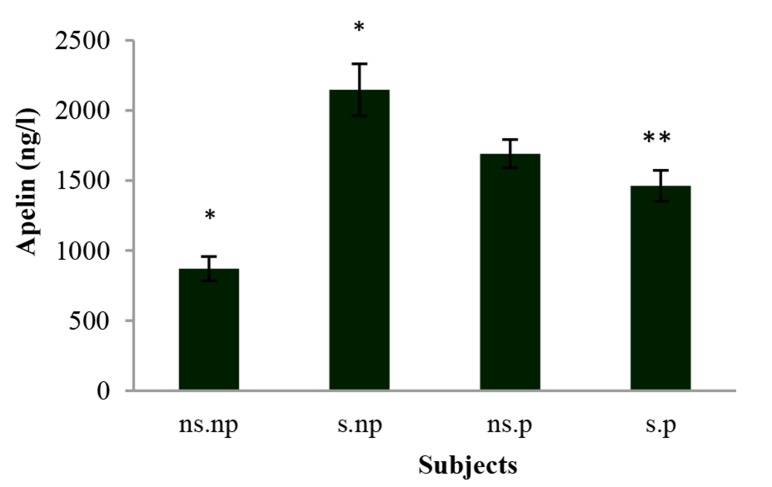
Figure 1.
The levels of apelin-12 in serum of subjects ns.np: Non-smoker non-patient; s.np: Smoker non-patient; ns.p: Non-smoker patient; s.p: Smoker patient Data are expressed as mean ± standard deviation (SD) *A statistically significant difference vs. ns.np; **A statistically significant difference vs. s.np

