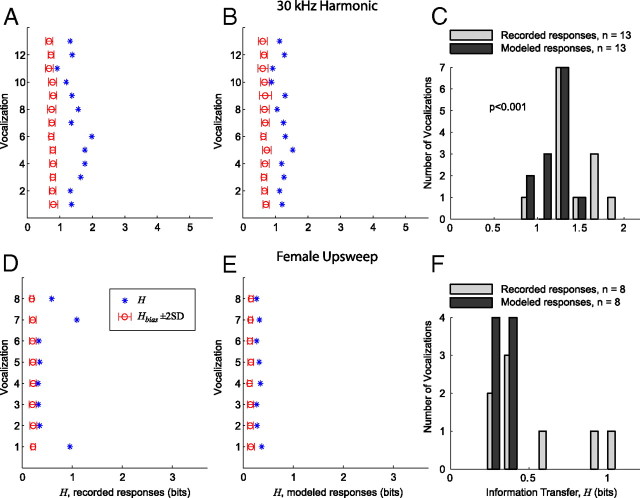
Figure 13.
IC responses are more heterogeneous to a given vocalization than is predicted by modeled responses from lower auditory nuclei. A, Information transfer (H) for each variant of the 30 kHz harmonic vocalization, measured across all neurons that responded to at least one of the variants. The open circle and error bars indicate H̄bias + 2 SD. The x-axis spans the bounds of H [(0 log2Nneurons) bits]. B, H for each variant of the 30 kHz harmonic vocalization using the responses modeled from the pure tone response properties of each neuron. C, Histogram comparing the recorded and modeled distributions of H for the vocalization variants with significant information transfer (H̄bias + 2 SD). H for the recorded data is significantly greater than H for the modeled data (two-sample Kolmogorov–Smirnov test, p < 0.001). D, Information transfer (H) for each variant of the female upsweep vocalization, measured across all neurons that responded to at least one of the variants. The three variants with the elevated values of H are as follows: natural (bottom), time stretched, and time compressed (top). E, H for each variant of the female upsweep vocalization using the responses modeled from the pure tone response properties of each neuron. F, Histogram comparing the recorded and modeled distributions of H for the vocalization variants with significant information transfer (H̄bias + 2 SD). H for the recorded data and H for the modeled data are not significantly different. This is primarily attributable to the small sample size (n = 8).

