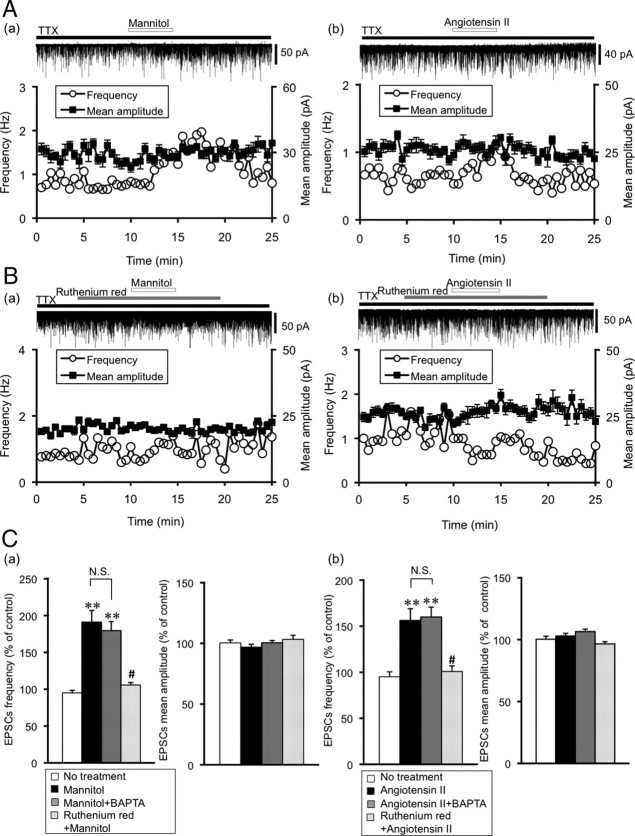
Figure 1.
Effects of mannitol and angiotensin II on mEPSCs in the SON. A, Representative examples of mannitol (a) (60 mm, 360 mOsmol/kg) and angiotensin II (b) (0.1 μm) on mEPSCs. EPSCs were recorded in the presence of TTX (1 μm). The holding potential was −70 mV. Plots of frequency are single measurements, whereas plots of amplitude are mean ± SEM over 30 s. B, Representative examples of the effects of a nonspecific TRPV1 blocker, ruthenium red (10 μm) on mannitol (a)- and angiotensin II (b)-induced potentiation of mEPSCs. Mannitol- and angiotensin II-induced potentiation of mEPSCs was suppressed by ruthenium red. C, Summary data for the effects of ruthenium red on the frequency and amplitude of mEPSCs. a, Frequency (left) and amplitude (right) of mEPSCs. No treatment (n = 7), mannitol (n = 8), mannitol plus BAPTA (n = 8) and mannitol plus ruthenium red (n = 6), respectively. b, No treatment (n = 7), angiotensin II (n = 8), angiotensin II plus BAPTA (n = 9) and angiotensin II plus ruthenium red (n = 13). BAPTA in the pipette solution did not affect the potentiation of mEPSCs by mannitol and angiotensin II. Data are mean ± SEM. **p < 0.01, compared with no treatment. #p < 0.01, compared with mannitol or angiotensin II.

