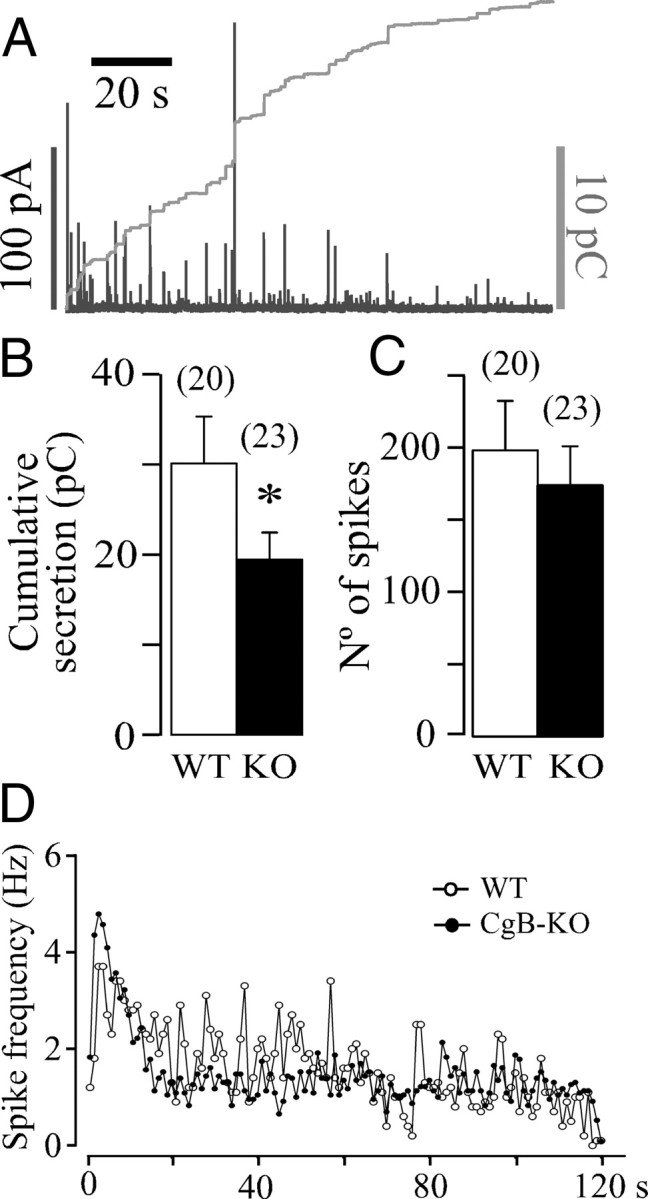
Figure 1.

The secretory profile of chromaffin cells lacking CgB. A, A typical amperometric trace obtained from a CgB-KO cell after a 10 s pressure application of BaCl2 (5 mm); left black calibration bar is for the amperometry trace (in picoamperes) and the right gray bar for the integrated signal (in picocoulombs). B, Quantification of the cumulated release after 2 min (means ± SEM) expressed in picocoulombs. The number of cells used is in brackets. *p = 0.053 (U Mann–Whitney). Stimuli were applied at 0 s time. C, Total amount of spikes (means ± SEM) counted for 2 min after stimulation. D, Distribution of spikes expressed in hertz. Each point is the average of counting spikes at 1 s intervals.
