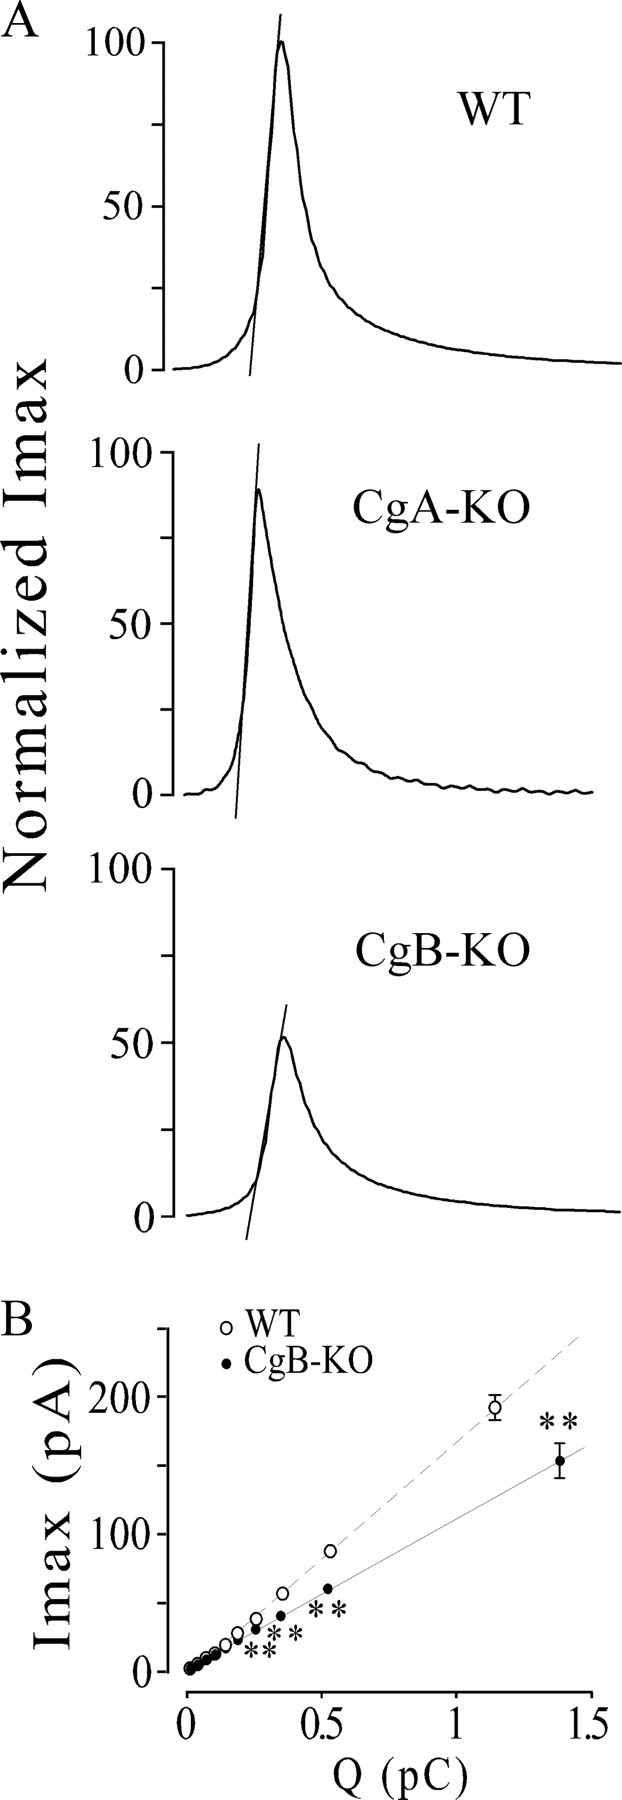
Figure 5.

Kinetics profiles of amperometric spikes from CgA- or CgB-KO chromaffin cells. A, Traces illustrate the kinetics changes observed in the exocytosis from cells lacking in CgA or CgB. Spikes were constructed by averaging spikes; their corresponding values of Imax, t1/2, m, Ft1, and Ft2 coincide with the values given in Table 1 of a previous paper (Montesinos et al., 2008) and from Table 1 of this paper. Discontinuous lines show the ascending slopes (m) obtained by linear fit of 25–75% segment of the ascending portion of spikes. B, Spike amplitude versus quantal size of secretory spikes from CgB-KO (CgB−/−) and WT mice. All spikes (from WT and CgB-KO) were pooled regardless of whether they were from WT or KO cells and then distributed into 10 intervals of increasing charge containing the same number of spikes. The spikes were then split into WT and KO, and their Imax (mean ± SEM) was analyzed. Note that, at similar quantal size, the spikes from CgB-KO have a smaller Imax than WT. U Mann–Whitney with the correction of Bonferroni, **p < 0.001. Data are averaged from the spikes of Table 1.
