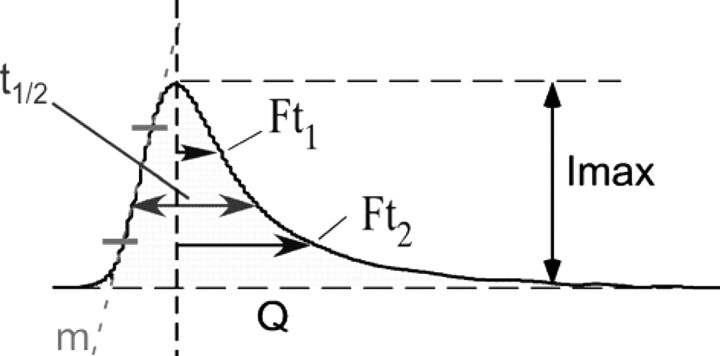
Table 1.
Characteristics of secretory spikes obtained from chromaffin cells of CgB-KO mice
 | |||||||
|---|---|---|---|---|---|---|---|
| Imax (pA) | Q (pC) | t1/2 (ms) | m (pA/ms) | Ft1 (ms) | Ft2 (ms) | n (cells) | |
| WT | 61.4 ± 7.8 | 0.39 ± 0.05 | 6.1 ± 0.5 | 27.5 ± 3.5 | 2.9 ± 0.2 | 5.9 ± 0.6 | 20 |
| CgB-KO | 33.5 ± 5.8† | 0.27 ± 0.04¥ | 6.4 ± 0.4 | 14.2 ± 2.7§ | 3.7 ± 0.2 | 6.1 ± 0.4 | 20 |
| Change | −45% | −31% | +5% | −48% | +28% | +22% | |
See Segura et al. (2000) for explanation. Data are expressed in the units in parentheses.
†p = 0.02; ¥p = 0.054; §p = 0.001 (U Mann–Whitney).
