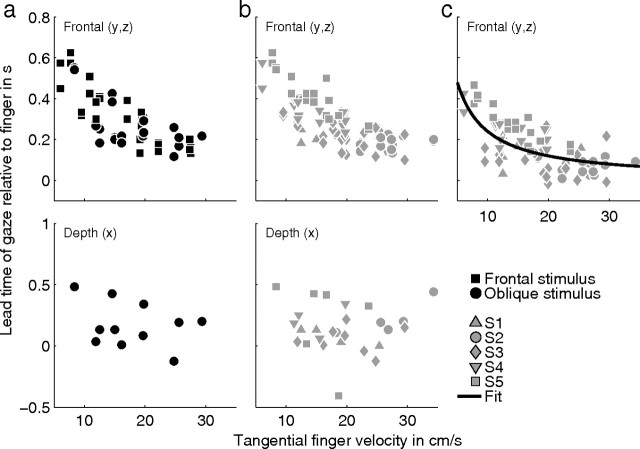
Figure 6.
Lead times of gaze relative to finger for the tracing condition. The top and bottom show values for the frontal directions (y and z) and the depth direction (x), respectively. a, Time of the peak of the cross-covariance function between gaze and finger position as a function of the mean tangential finger velocity. Only data for the Cassini and Limaçon stimulus shapes are shown. Squares and circles represent data for the frontal and oblique stimulus orientations, respectively. The lead times shown here represent the total lead time (see Fig. 3b). b, Same as a, but lead times of trials with the helices as stimulus shape are included as well. Different gray symbols refer to data from different subjects. c, Time of the peak of the cross-covariance function between gaze position after interpolation of the saccade onsets with a cubic spline and finger position. The lead times shown here represent the primary lead time (see Fig. 3c). Different gray symbols refer to data from different subjects. The black line shows the best fit of τo = over all subjects.

