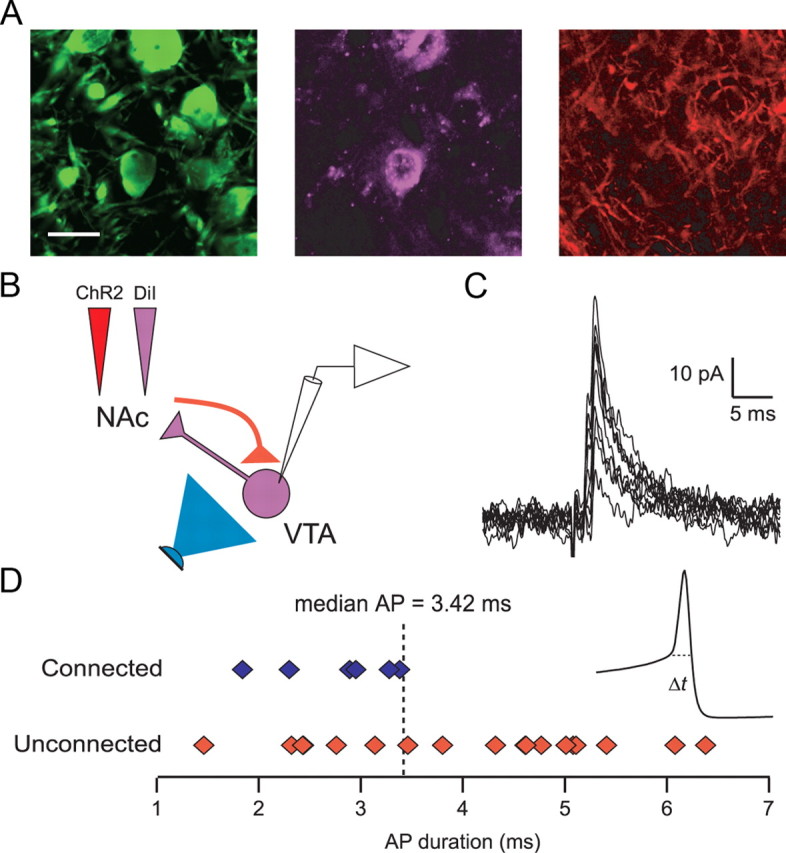
Figure 5.

NAc MSNs target NAc-projecting VTA neurons. A, Triple-labeled VTA slice showing TH (green), DiI (violet), and ChR2 (red) after microinjection of DiI and ChR2 into the NAc. Scale bar, 20 ìm. B, Diagram of experimental design. Light stimulation (blue) of ChR2-expressing NAc MSN terminals (red) while recording from retrogradely labeled VTA neurons (violet). C, Ten consecutive light-evoked IPSCs from a retrogradely labeled VTA neuron. D, Distribution of action potential durations from connected (blue) and unconnected (red) NAc-projecting neurons. Inset shows average of 10 consecutive action potentials (AP; from example in C). Dashed line indicates where action potential duration was measured.
