
Figure 6.
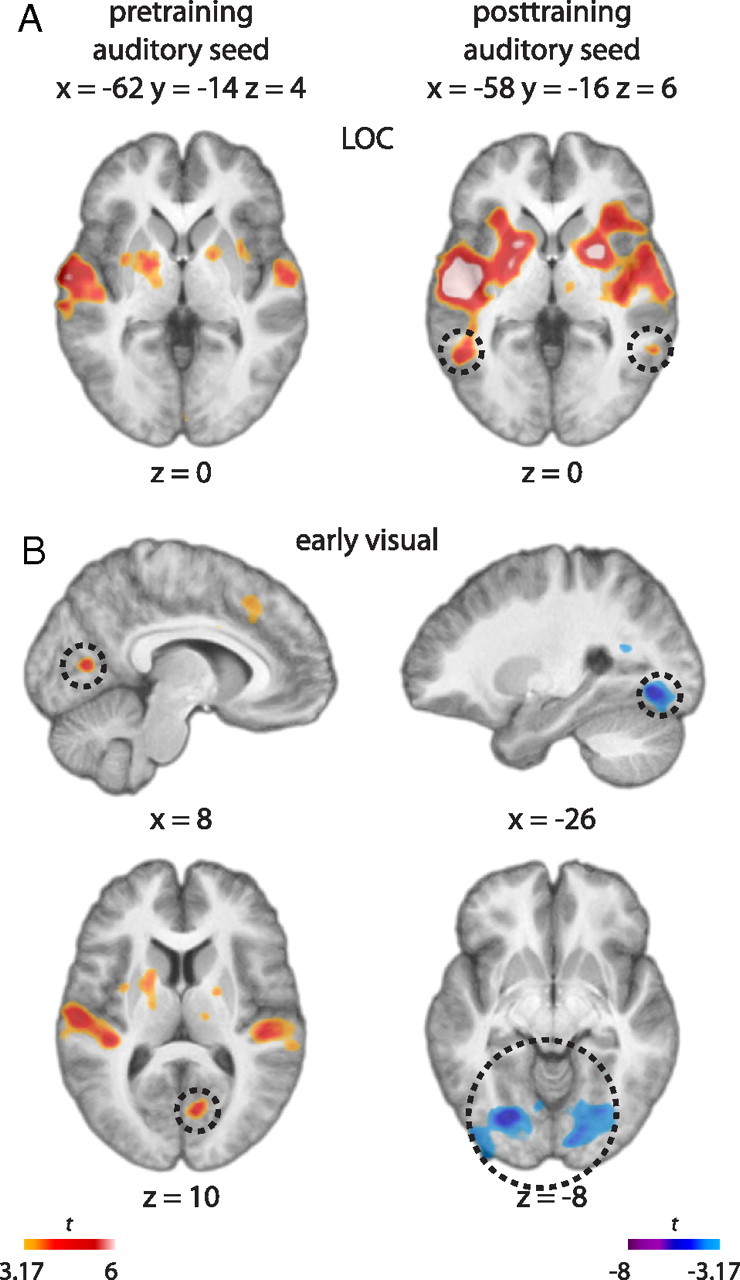
A, Results of the functional connectivity analysis shown in a t map. The analysis showed that BOLD activity at an auditory cortex seed region, selected as the peak from the shape-listen minus control-listen contrast (xpre, ypre, zpre = −62, −14, 4; xpost, ypost, zpost = −58, −16, 6), was correlated with that of the LOC (dotted circles) after but not before training (activity shown at z = 0). B, The same analysis also yielded positive correlation with the early visual cortex before training (dotted circles at x = 8, z = 10) but negative correlation in more ventral portions of early visual cortex after training (dotted circles at x = −26, z = −8).