FIGURE 2.
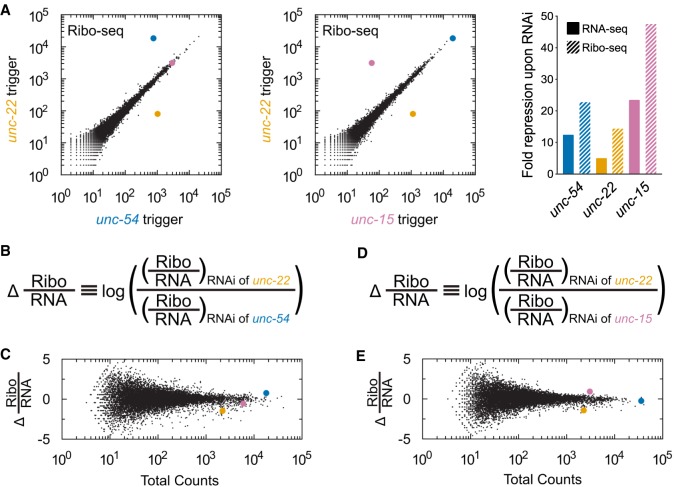
Repression at the level of translation is greater than expected from RNA loss alone. (A) Genome-wide Ribo-seq of animals after RNAi against unc-22 (y-axis), unc-54 (x-axis, left plot), or unc-15 (x-axis, right plot). Samples are the same as those used for RNA-seq in Figure 1B, and transcripts are highlighted with the same color scheme. Similar knockdown was observed at other developmental stages (Supplemental Fig. S3). Bar graphs on the far right show quantification of fold changes between RNAi and non-RNAi samples for the respective genes’ mRNAs in RNA-seq (with Fig. 1) and Ribo-seq libraries. (B) Equation used to normalize Ribo-seq counts to differences in RNA levels. For each gene in each library, we calculated read counts per million mapped reads. We divided read counts in a Ribo-seq library by read counts from the corresponding RNA-seq library and compared this number between different RNAi conditions. (C) Dot plot showing changes in Ribo-seq read counts (normalized to RNA-seq) between libraries. Y-axis position is determined by equation in part B. A more positive score indicates fewer Ribo-seq read counts normalized to RNA-seq upon RNAi of unc-54; a more negative score indicates fewer Ribo-seq read counts normalized to RNA-seq upon RNAi of unc-22. X-axis position is the total number of read counts across all libraries (2 Ribo-seq and 2 RNA-seq libraries). unc-54, unc-22, and unc-15 are highlighted using the same color scheme as in Figure 1. (D, E) Same as B and C but with unc-22 and unc-15 libraries. A more positive score indicates fewer Ribo-seq read counts normalized to RNA-seq upon RNAi of unc-15; a more negative score indicates fewer Ribo-seq read counts normalized to RNA-seq upon RNAi of unc-22.

