FIGURE 5.
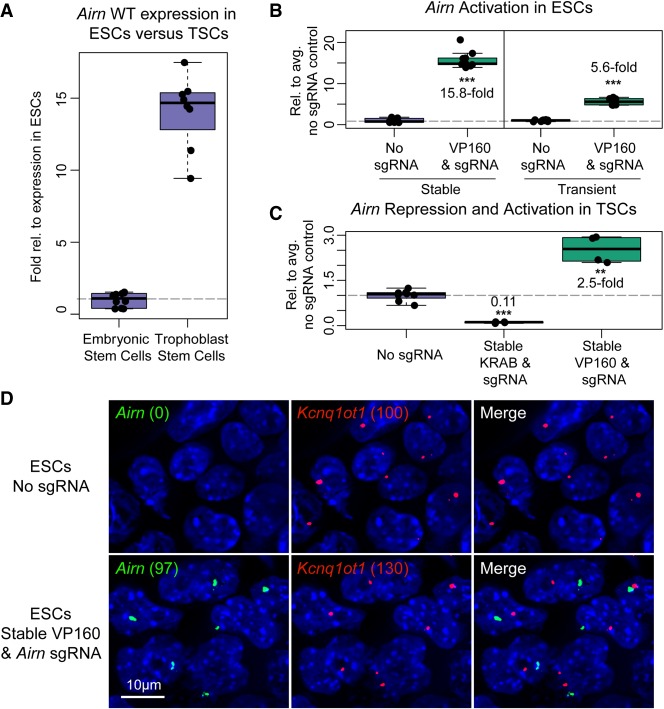
Activation and repression of lncRNA transcription using CRISPR-Bac. See Supplemental Table S2 for details on replicates and experimental design for each figure panel. All individual qPCR data points are shown in box-and-whisker format representing the mean and the interquartile range. (***) P < 0.001; (**) P < 0.01 from a two-sided t-test between no sgRNA and sgRNA-expressing cells. (A) qPCR showing relative levels of Airn expression in wild-type ESCs and TSCs. (B) qPCR measuring Airn transcriptional activation in ESCs with stably transfected CRISPR-Bac constructs, dCas9-VP160 and Airn-targeting sgRNA, versus transient transfection of dCas9-VP160 and SPgRNA-Airn. Data from the nontargeting sgRNA control (No sgRNA) and sgRNA-expressing cells are plotted relative to the average of the signal in the No sgRNA control cells. (C) qPCR results for TSCs with stably transfected dCas9-KRAB or dCas9-VP160 and Airn-targeting sgRNA. Data are plotted as in B. (D) Representative RNA FISH image showing Airn and Kcnq1ot1 RNA in ESCs harvested alongside ESCs from B. Numbers in parentheses correspond to spots counted by Imaris software for Airn and Kcnq1ot1 in each cell line. Scale bar, 10 µm.

