
FIGURE 7.
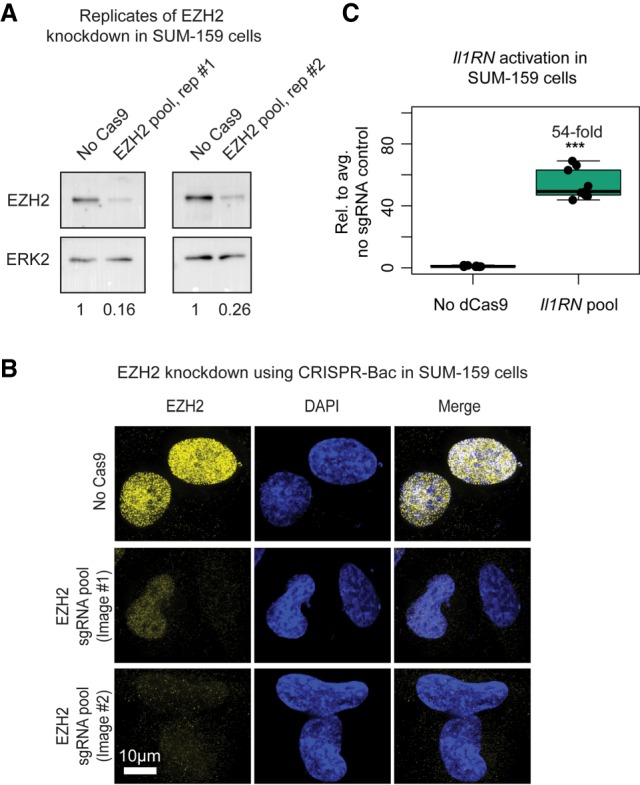
The CRISPR-Bac system functions in human cell lines. See Supplemental Table S2 for details on replicates and experimental design for each figure panel. (A) Western blots to EZH2 and ERK2 loading control from two replicate CRISPR-Bac experiments in SUM-159 cells. “No Cas9” refers to measurements taken from dCas9-VP160/rtta-Il1RN sgRNA expressing SUM-159 cells that were cultured in parallel to those expressing Cas9 and the EZH2 sgRNA pool. Values underneath blots represent knockdown of EZH2 relative to No Cas9 control and normalized for loading with ERK2 protein levels. (B) Representative IF images showing EZH2 knockdown from “No Cas9” and “EZH2 pool, rep #1” SUM-159 cells in A. Image #1 shows a cell with partial knockdown next to a cell with full knockdown, and image #2 shows two cells with full knockdown. Scale bar, 10 µm. (C) qPCR results showing transcriptional activation of Il1RN in SUM-159 cells. In panel C, “No dCas9” refers to measurements taken from Cas9/rtta-EZH2 sgRNA expressing SUM-159 cells that were cultured in parallel to those expressing dCas9 and the Il1RN sgRNAs. Data from the nontargeting sgRNA control (No sgRNA) and sgRNA-expressing cells are plotted relative to the average of the signal in the No sgRNA control cells. Individual qPCR data points are shown in box-and-whisker format. (***) P < 0.001 from a two-sided t-test between no sgRNA and sgRNA-expressing cells.