
Figure 1.
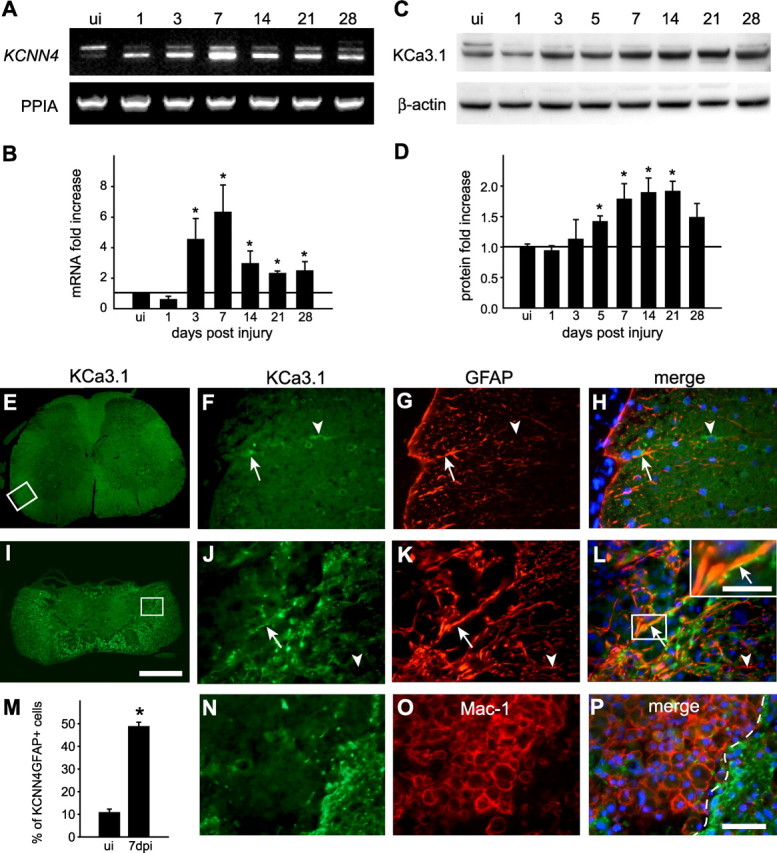
KCNN4/KCa3.1 expression increases after SCI. A, B, RT-PCR analysis of KCNN4 mRNA levels in spinal cord from uninjured (ui) mice and 1, 3, 5, 7, 14, and 21 dpi mice. PPIA was used as a loading control. A representative example is shown in A. For the quantification in B, data were first normalized to PPIA and then expressed as fold change (mean ± SD; 3 experiments, n = 3) compared with the uninjured spinal cord (horizontal line). Significant increases in KCNN4 expression are indicated as follows: *p < 0.05. C, Western blot analysis of the 47-kDa-molecular-weight band labeled with anti-KCa3.1 antibody in spinal cord homogenates. β-actin was used as the loading control. D, Quantification of KCa3.1 protein levels (*p < 0.05; n = 3). The horizontal line indicates the level in uninjured control spinal cords. E, Low-magnification image of the normal, uninjured spinal cord immunolabeled for KCa3.1. The area in the box is shown at higher magnification in F–H. Higher magnification showing double labeling for KCa3.1 (F) and the astrocyte marker GFAP (G) (arrow), and the merged image with DAPI-stained nuclei (H). Note also the single labeled cell (arrowhead). I, Low-magnification image of the injured spinal cord at 7 dpi immunolabeled for KCa3.1. The area in the box is shown at higher magnification in J–L. Higher-magnification images showing double labeling for KCa3.1 (J) and GFAP (K) (arrows), and the merged images with DAPI-stained nuclei (L). Note the increase in KCa3.1 labeling of GFAP+-reactive astrocytes (arrows); the inset in L shows double-labeled profiles at higher magnification (arrow). In the inset, note that the strongest labeling for KCa3.1 is on the membrane, while the GFAP labeling is intracellular. Arrowheads in J–L show a single-labeled GFAP+/KCa3.1− profile. M, Quantification of the percentage of GFAP+ cells colabeled for KCa3.1 at 7 dpi compared with the uninjured cord (*p < 0.001, n = 4). N–P, The lesion core at 7 d after SCI is double labeled for KCa3.1 (N) and the microglia/macrophage marker Mac-1 (O). The lesion core is to the left of the dashed line in the merged image (P), which also shows DAPI-stained nuclei. Scale bars: E, I, 500 μm; H, L, P, 50 μm; L inset, 30 μm.