Figure 4.
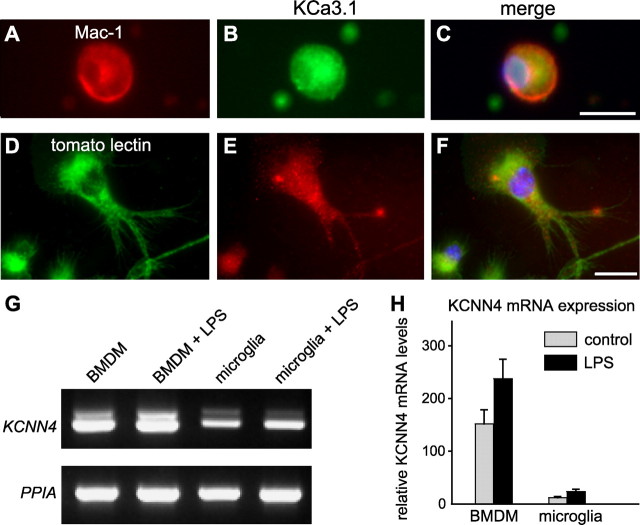
KCNN4 mRNA and KCa3.1 immunoreactivity are expressed in ex vivo macrophages and in primary cultures of macrophages/microglia. A–C, Representative images of double labeling for CD11b (Mac-1 antibody) (A) and KCa3.1 (B) of macrophages isolated from spinal cord 7 d after SCI; the merged image (C) includes nuclear DAPI staining. Note that the large, round Mac-1+ macrophage shows cytoplasmic labeling for KCa3.1. Scale bar: (in C) A–C, 20 μm. D–F, Representative images of unstimulated cultured mouse microglia double labeled with tomato lectin (D) and anti-KCa3.1 antibody (E); the merged image (F) includes DAPI-stained nuclei. Scale bar: (in F) D–F, 10 μm. G, RT-PCR analysis shows mRNA expression of KCNN4 in primary cultures of BMDMs and cultured microglia, with and without activation by LPS treatment. H, Note the much higher KCNN4 expression in BMDMs than in microglia. Values are mean ± SEM, n = 3.

