
Figure 2.
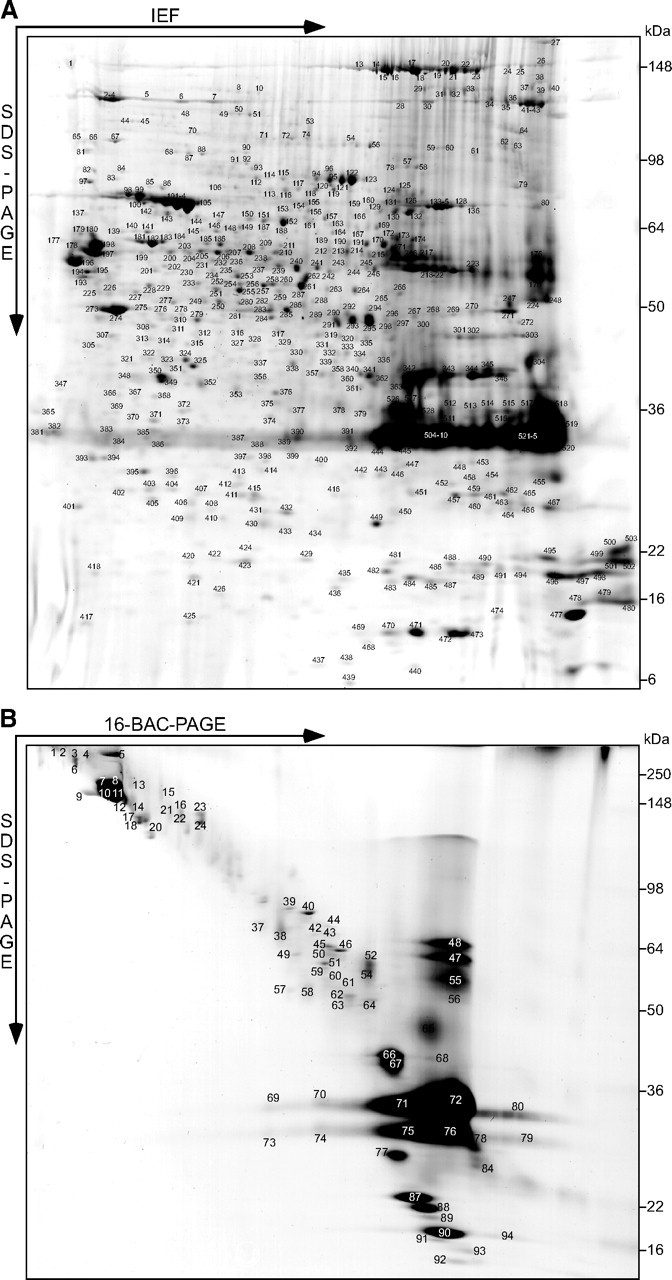
Two-dimensional myelin proteome maps. A, B, Myelin purified from wild-type sciatic nerves was separated in different gel systems, and proteins visualized by colloidal Coomassie staining were subjected to mass spectrometric protein identification. Representative gels are shown. The protein identities of all individual spots will be hosted on the author's web page (see Notes). This material has not been peer reviewed. A, 2D-IEF/SDS-PAGE with IEF in a nonlinear pH gradient (3–11) as the first and SDS-PAGE as the second dimension. Proteins were identified by an automated platform based on MALDI-TOF-MS (485 unequivocal identifications from 528 picked spots). B, 2D-16-BAC/SDS-PAGE with separation in a 16-BAC gel as the first and SDS-PAGE as the second dimension. Proteins were identified by HPLC-MS/MS to address the higher sample complexity resulting from the limited resolution of the gel (74 identifications from 94 picked spots).