
Figure 7.
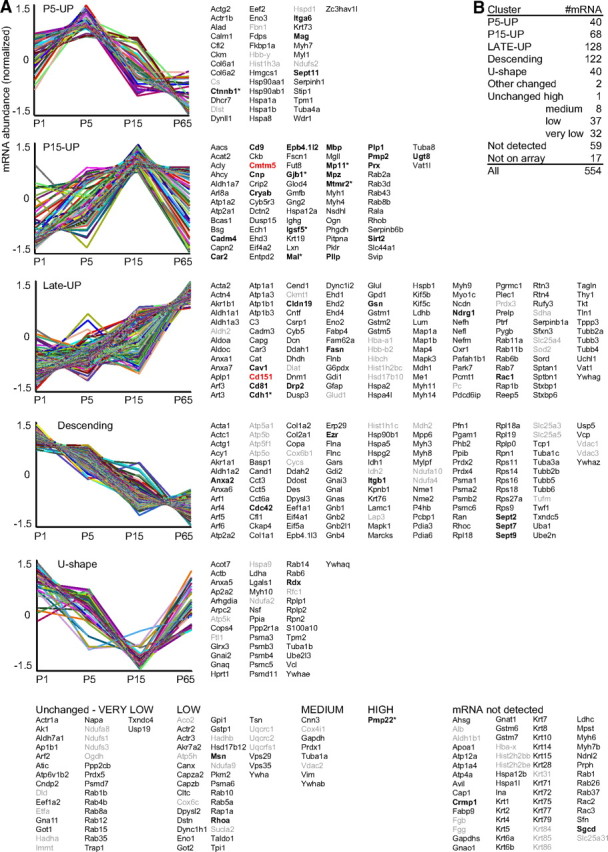
mRNA abundance profiles of myelin-associated genes in developing sciatic nerves. A, K-means clustering was performed for those 529 of 546 proteins in our compendium for which corresponding oligonucleotides were present on the arrays. Eight genes marked with an asterisk were additionally included for comparison, though the proteins were not identified by MS. The normalized mRNA abundance profiles are plotted with regard to the age (mouse postnatal days 1, 5, 15, and 65). Genes with significant mRNA abundance changes were categorized in five clusters, and genes with developmentally unchanged expression were grouped according to mRNA abundance. Known myelin genes are in bold, the novel myelin genes Cmtm5 and Cd151 are in red, and genes encoding mitochondrial, blood, hair, or nuclear proteins are in gray. In clusters P5-UP and P15-UP, the mRNA abundance is highest around the peak of myelination, while mRNA abundance in cluster Late-UP is highest after developmental myelination. mRNAs in cluster descending are significantly suppressed during development, though the corresponding proteins were identified in mature myelin. Note that a significant number of mRNAs is developmentally unchanged. B, The numbers of mRNAs per cluster are given. Note that only two mRNAs show developmental changes not fitting in any cluster.