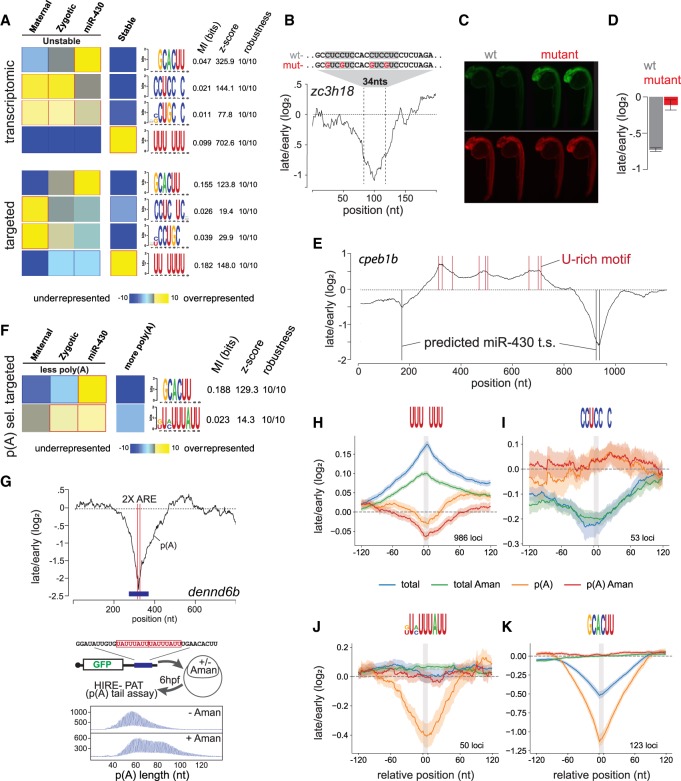
Figure 3.
Identifying destabilizing and stabilizing regulatory motifs. (A) FIRE top selected motifs. In the heatmap, overrepresentation (yellow) and underrepresentation (blue) patterns are shown for each discovered motif in the corresponding category. Also shown are the mutual information values, Z-scores associated with a randomization-based statistical test and robustness scores from a threefold jackknifing test. (B) RESA transcriptome coverage ratio for the zc3h18 locus zoomed in on peak containing multiple copies of the CCUC motif. (C) Zebrafish 24-h embryos injected with WT (CCUC motifs) or mutant (CGUC motifs) reporters. (n = 50) (D) Bar graphs displaying independent validation by RT-PCR (three replicates, 25 embryos each). (E) RESA-targeted coverage ratio for the cpeb1b (also known as zorba) locus. U-rich and miR-430 target sites are marked with red and black bars, respectively. (F) Same as A for poly(A) selected RESA-targeted library. (G) RESA targeted with poly(A) selection coverage ratio plot showing the two ARE sites (red lines) within the dennd6b locus (top). HIRE-PAT assay measuring impact of dennd6b ARE sites on poly(A) tail length reporter. Shortening of poly(A) tail length is zygotic transcription dependent as shown by longer poly(A) tail after α-amanitin treatment (bottom). (H–K) Motif-centered metaplots for U-rich (H), CCUCCNC (I), ARE (J), and miR-430 (K) motifs. Targeted RESA libraries coverage ratio were averaged over windows centered on RBP motif (RESA minimum coverage >0.01 CPM). Motif is represented with gray bar. SEM of RESA is shown by shaded outlines.

