Figure 4.
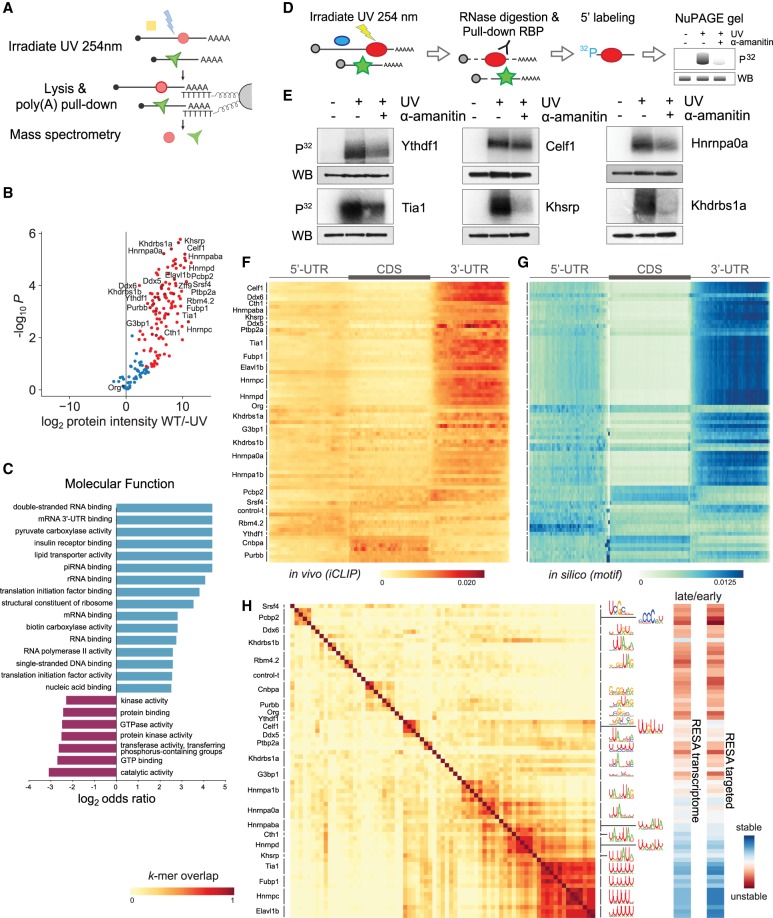
Mapping RNA-interacting factors in the embryo and identifying putative regulatory factors driving mRNA stability. (A) Diagram summarizing the interactome capture protocol. After UV crosslinking and poly(A) mRNA pull-down, RBPs are identified using mass spectrometry. (B) Volcano plot showing the RBPs significantly enriched over background by interactome capture. (C) GO term enrichment analysis characterizing the molecular functions of the captured proteins. (D) Cartoon depicting the rationale behind a label-transfer experiment to validate RNA–protein interactions. P32 autoradiograph indicates the amount of RNA, whereas while FLAG western blot indicates RBP levels. (E) Validation of the RNA-binding activity during zebrafish development of representative RPBs identified in the interactome capture. (F) Heatmap representing iCLIP metaplots of RBP binding within protein-coding transcripts. The UTRs and CDS of each transcript were split into 50 bins to normalize their length. Metaplots averaged over each RBP were clustered to group similar binding profiles. (G) Heatmap representing in silico binding profiles obtained by scanning for RBP binding motifs within protein-coding transcripts. Motifs are represented in H. (H) Heatmap illustrating the overlap among RBP binding motifs. Motifs were characterized using the top 20 6-mers most bound normalized by iCLIP control. For example, two proteins with the same top 6-mers received a 1.0 overlap score and represented in dark red (left). RESA averaged coverage ratio for each motif (right).

