Figure 3.
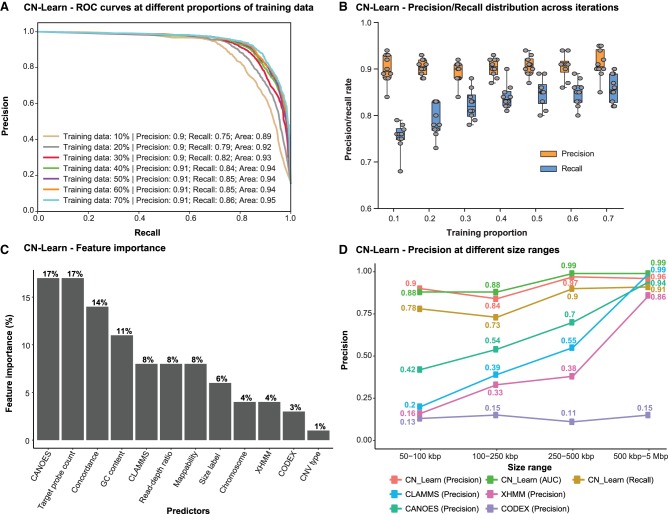
Characteristics of the CN-Learn binary Random Forest classifier. (A) Receiver operating characteristic (ROC) curves indicating the trade-off between the precision and recall rates when CN-Learn was trained as a Random Forest classifier are shown. Each curve represents the performance achieved when using different proportions of samples to train CN-Learn, starting from 10% up to 70% in increments of 10%. The results shown were from experiments aggregated across 10-fold cross-validation. (B) Variability observed in the precision and recall measures during the 10-fold cross-validation at various proportions of training data is shown. Both measures varied within ± 5% of their corresponding averages. (C) The relative importance of each genomic and caller-specific feature supplemented to CN-Learn is shown. Data shown here are the averages of the values obtained across 10-fold cross-validation after using 70% of the samples for training. (D) Precision rates for CNVs when CN-Learn was trained at four different size ranges compared to the precision rates of CNVs from individual callers are shown. Precision rates for CN-Learn were estimated as its classification accuracy (true positives/[true positives + false positives]), whereas the precision rates for the individual callers were calculated as the proportion of CNVs at each size range that were validated by the microarray calls.

