Figure 4.
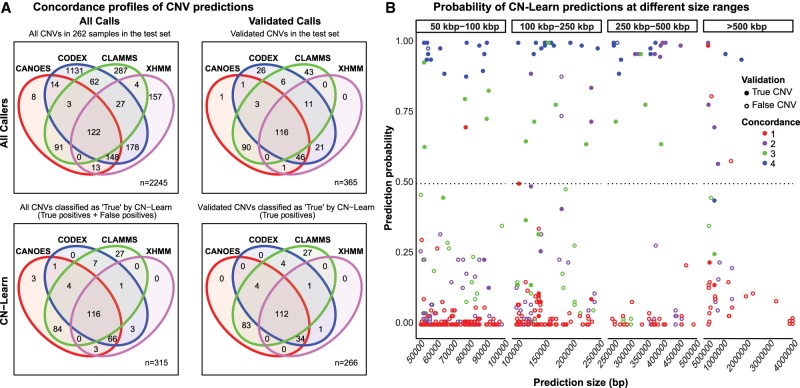
Concordance profiles of CNVs before and after classification by CN-Learn using microarray calls as the “gold standard” validation set. (A) Venn diagrams are shown for CNVs (≥50 kbp) identified from a random draw of 262 samples out of the total 291 samples before (top) and after (bottom) classification by CN-Learn. The Venn diagrams show the overlap of calls among the four callers (top left) versus those that were validated by microarrays (top right). Venn diagrams depicting the overlap of all true calls among the four callers after classification by CN-Learn (bottom left) and true calls that were also validated by microarrays are shown (bottom right). (B) The distribution of all calls within the 262 samples based on the probability scores (y-axis) predicted by CN-Learn across four size ranges (x-axis) is shown. The number of overlaps of each CNV with exome-based CNV callers is represented by different colors. CNVs that validated with microarrays are indicated by filled circles, and CNVs that did not validate with microarrays are represented by hollow circles.

