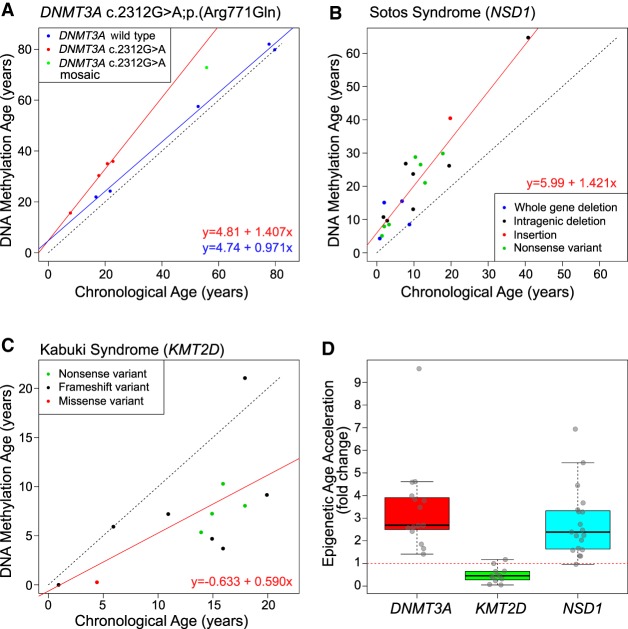
Figure 3.
Altered epigenetic aging is observed in methyltransferase-associated human growth disorders. (A) Scatter plot comparing “DNA methylation age” derived from the Illumina 450K data (y-axis) and actual chronological age (x-axis) in DNMT3A c.2312G > A p.(Arg771Gln) pathogenic variant carriers (red) versus wild-type family members (blue). Green indicates the mosaic individual. The linear regression model is also shown. (B) Scatter plot comparing DNA methylation age versus chronological age in patients with Sotos syndrome. In-frame legend illustrates the different NSD1 pathogenic variants studied. (C) Scatter plot comparing DNA methylation age versus chronological age in patients with Kabuki syndrome. In-frame legend illustrates the different KMT2D pathogenic variants studied. (D) Boxplot comparing the epigenetic age acceleration rates found in association with TBRS DNMT3A variants, KMT2D Kabuki syndrome variants, and NSD1 Sotos syndrome variants. Each age acceleration observation is plotted as a circle. The dotted red line denotes no age acceleration.

