
Figure 3.
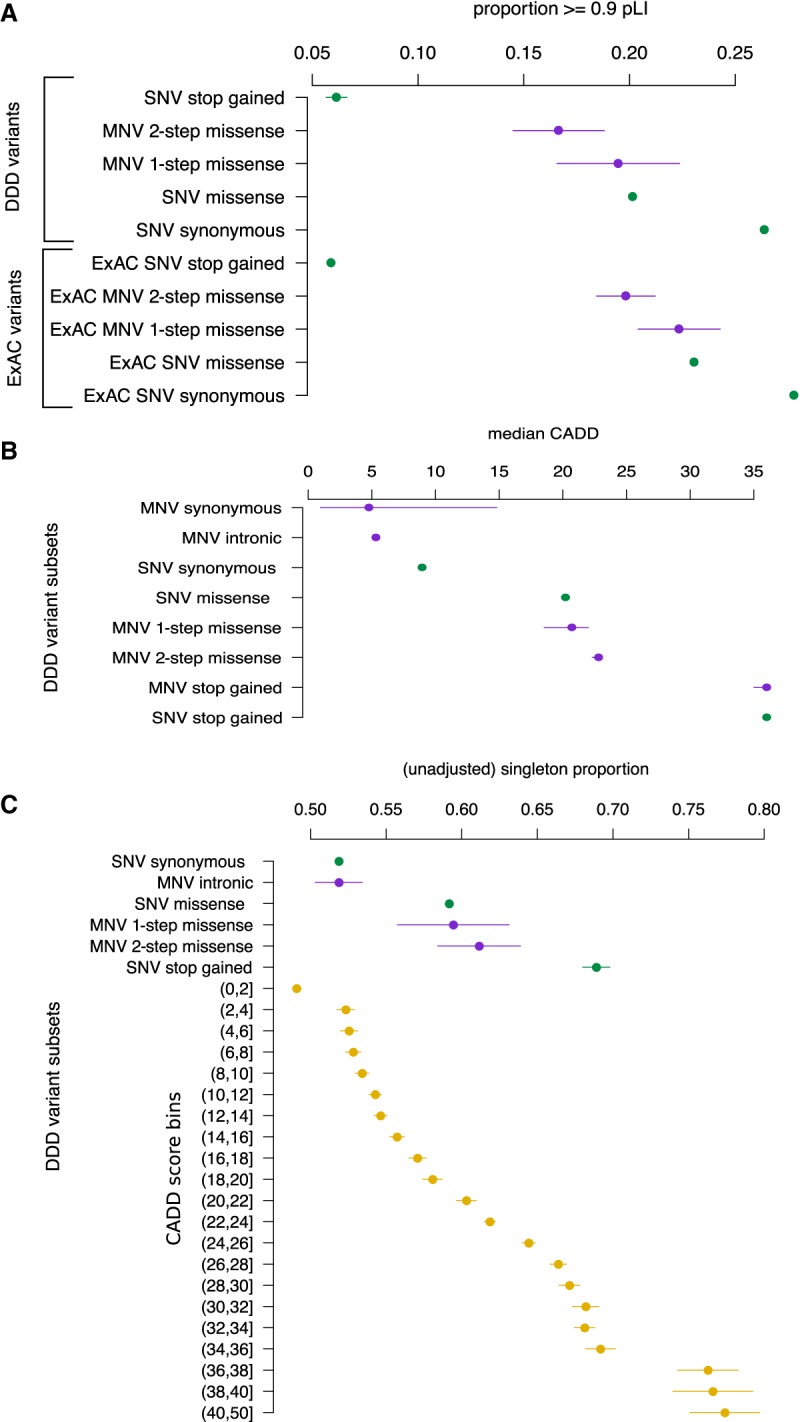
Quantifying the pathogenicity of MNVs. (A) Proportion of variants that fall in genes with pLI ≥ 0.9 over different classes of variants for both DDD and ExAC data sets. SNVs are green; MNVs, purple. Lines are 95% confidence intervals. (B) The median CADD score over different classes of variants identified from DDD data with bootstrapped 95% confidence intervals. (C) Singleton proportion for different classes of DDD variants. In yellow are SNVs stratified by binned CADD scores with their corresponding singleton proportions. Lines are 95% confidence intervals.