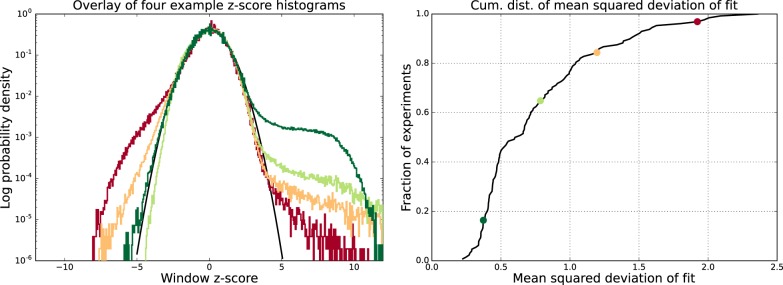
Figure 4.
Genome-wide fluctuations in ChIP signal fit Crunch's noise model. (Left) Examples of the z-value distributions of ChIP-enrichments genome-wide for four data sets (colored lines) together with the reference standard Gaussian (black line). The vertical axis is shown on a logarithmic scale. (Right) Cumulative distribution of the mean squared deviation between the observed z-value distribution and the standard Gaussian for the 128 ENCODE data sets. The locations in the cumulative distribution of the four data sets shown in the left panel are shown as correspondingly colored points.

