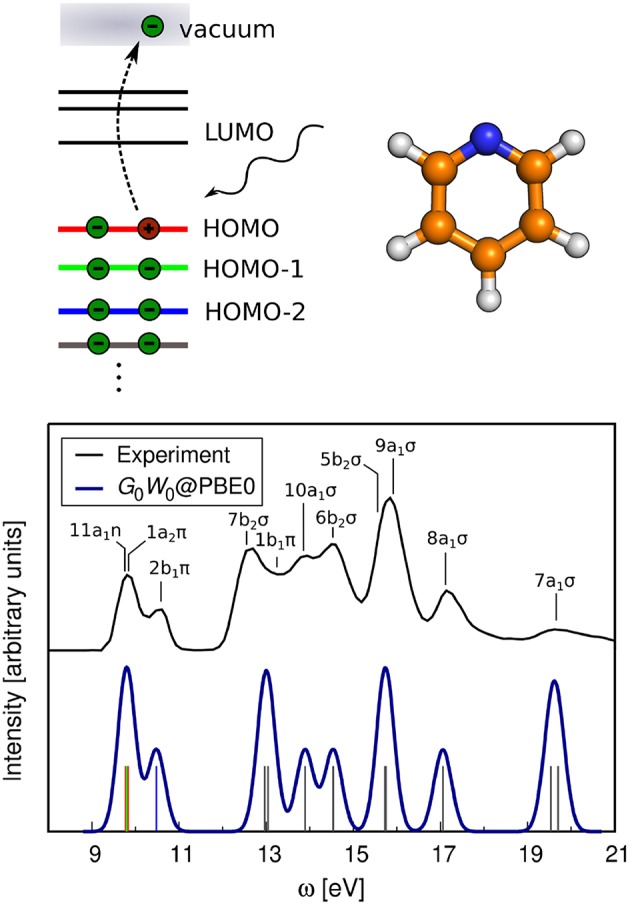
Figure 35.

Ionization spectrum of pyridine. G0W0@PBE0 QP energies compared to the experimental photoemission spectrum (Liu et al., 2011). The calculated spectrum has been artificially broadened; the position of the QP energies is indicated with vertical bars. All QP energies are extrapolated using the cc-pVnZ (n=3–6) basis sets, see Appendix C for further computational details. The QPs of the first valence states are colored in red, green and blue.
