
Figure 42.
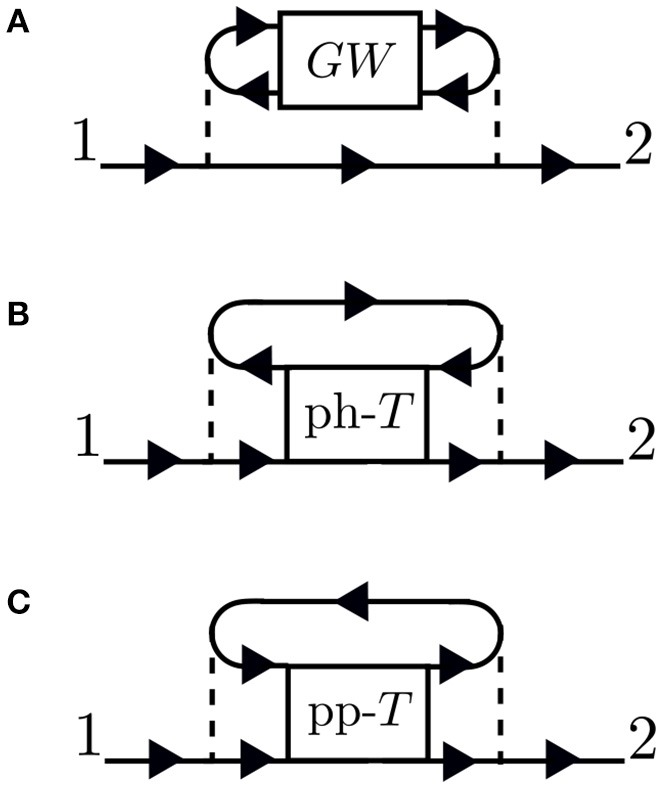
Schematic representation of diagrams included with (A) GW, (B) particle-hole T-matrix, and (C) particle-particle T-matrix. In each case, channels going into the box are correlated further with additional interactions.
Official websites use .gov
A
.gov website belongs to an official
government organization in the United States.
Secure .gov websites use HTTPS
A lock (
) or https:// means you've safely
connected to the .gov website. Share sensitive
information only on official, secure websites.
Schematic representation of diagrams included with (A) GW, (B) particle-hole T-matrix, and (C) particle-particle T-matrix. In each case, channels going into the box are correlated further with additional interactions.