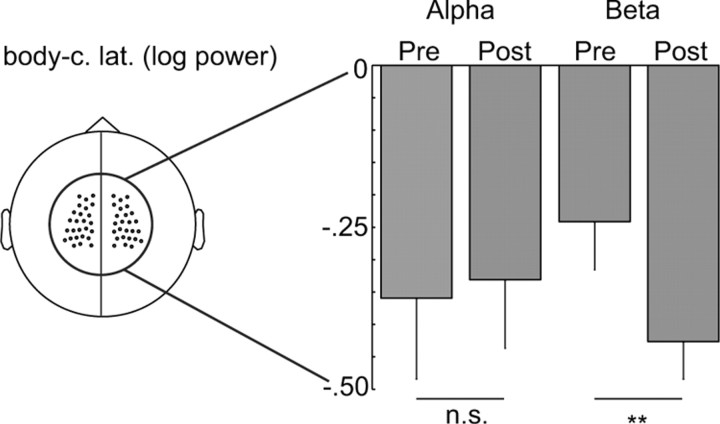
Figure 4.
Alpha- and beta-band power at central sensors show body-centered lateralization in anticipation of the tactile stimulus. The negative values indicate that there is a power suppression on the contralateral side, compared with the ipsilateral side. Bar plots (with SE) represent body-centered alpha- and beta-band log power during the prestimulus (−300 ms) and poststimulus response (400 ms) intervals for the sensors marked in the left panel. All power values are significantly different from zero (t test, p < 0.05). Asterisks indicate significant differences between prestimulus and poststimulus data (**p < 0.05, paired t test).

