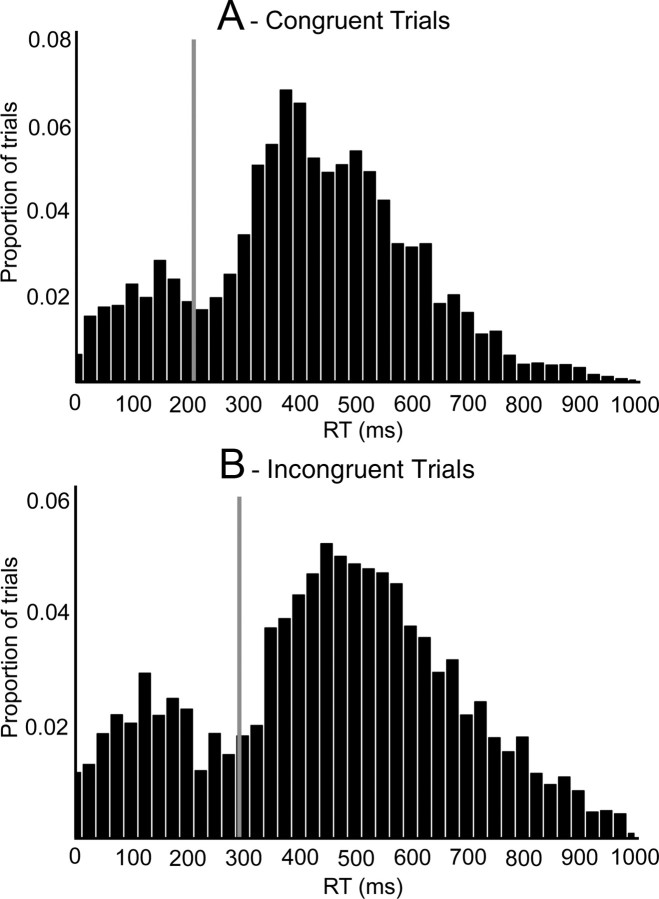
Figure 2.
RT distributions in 25 ms time windows from 0 to 1000 ms for congruent (A), and incongruent (B) responses averaged across all participants. Values on the y-axis correspond to the proportion of trials falling in each RT bin, with the x-axis representing RT. The vertical line represents the mean RT cutoff for separating the two distributions.

